📸 WireDoctor Report Tour
A guided walkthrough of the WireDoctor HTML console, tab by tab. Every screenshot and GIF here is from a real, unmodified run against start.spring.io — Spring Initializr itself — on WireDoctor 1.2.0 (Spring Boot 4.1.x, 394 beans · 435 wiring edges, test profile). Nothing is staged: no demo beans, no injected cycle. What the diagnostics find is what a real, well-maintained Spring app actually looks like — including 3 hidden module-boundary violations nobody had noticed. The full sample report set is in sample/v1.2.0/.
The report is a single self-contained wiredoctor-report.html — the graph library is inlined at generation time, so it renders completely offline. Just open it in a browser.
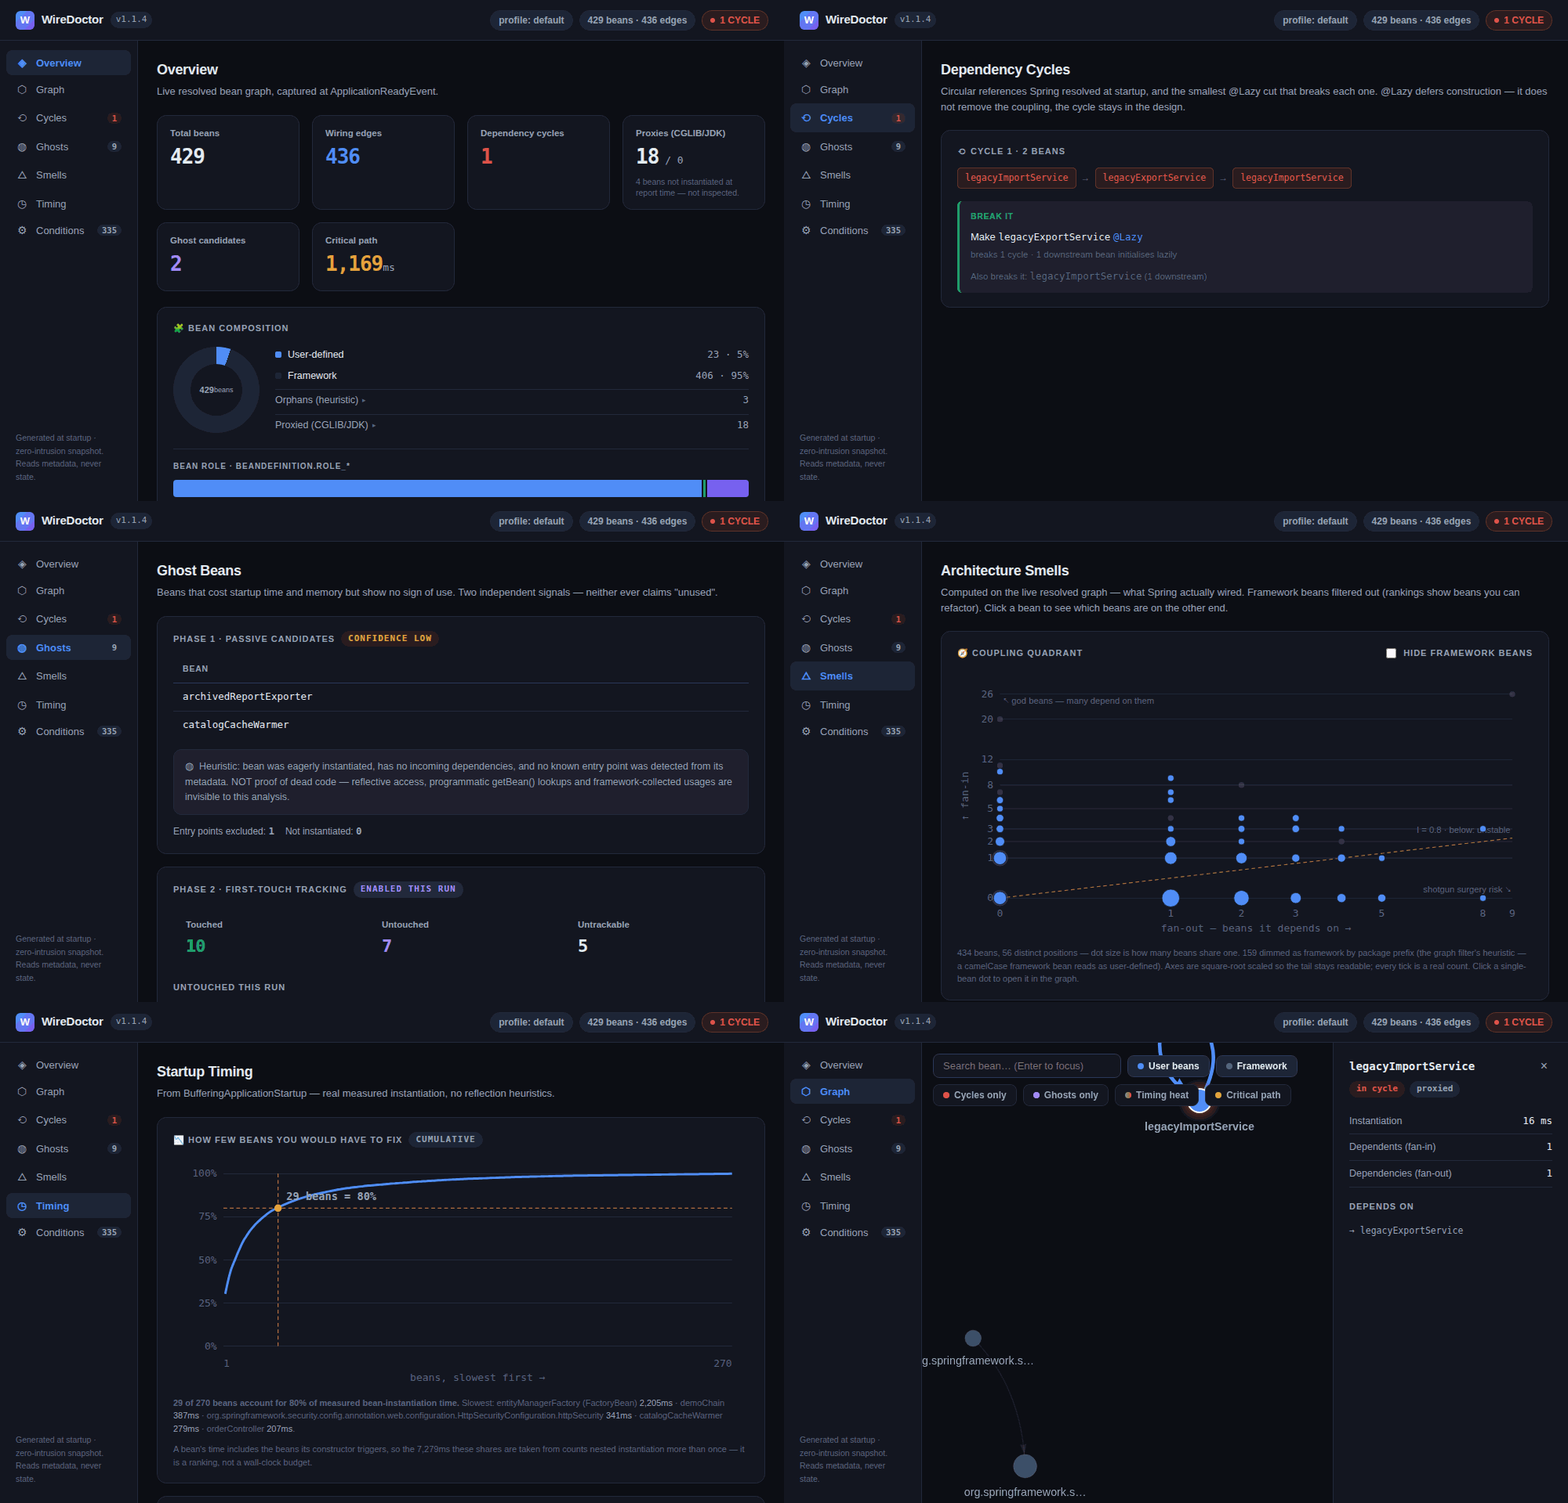
Overview tab
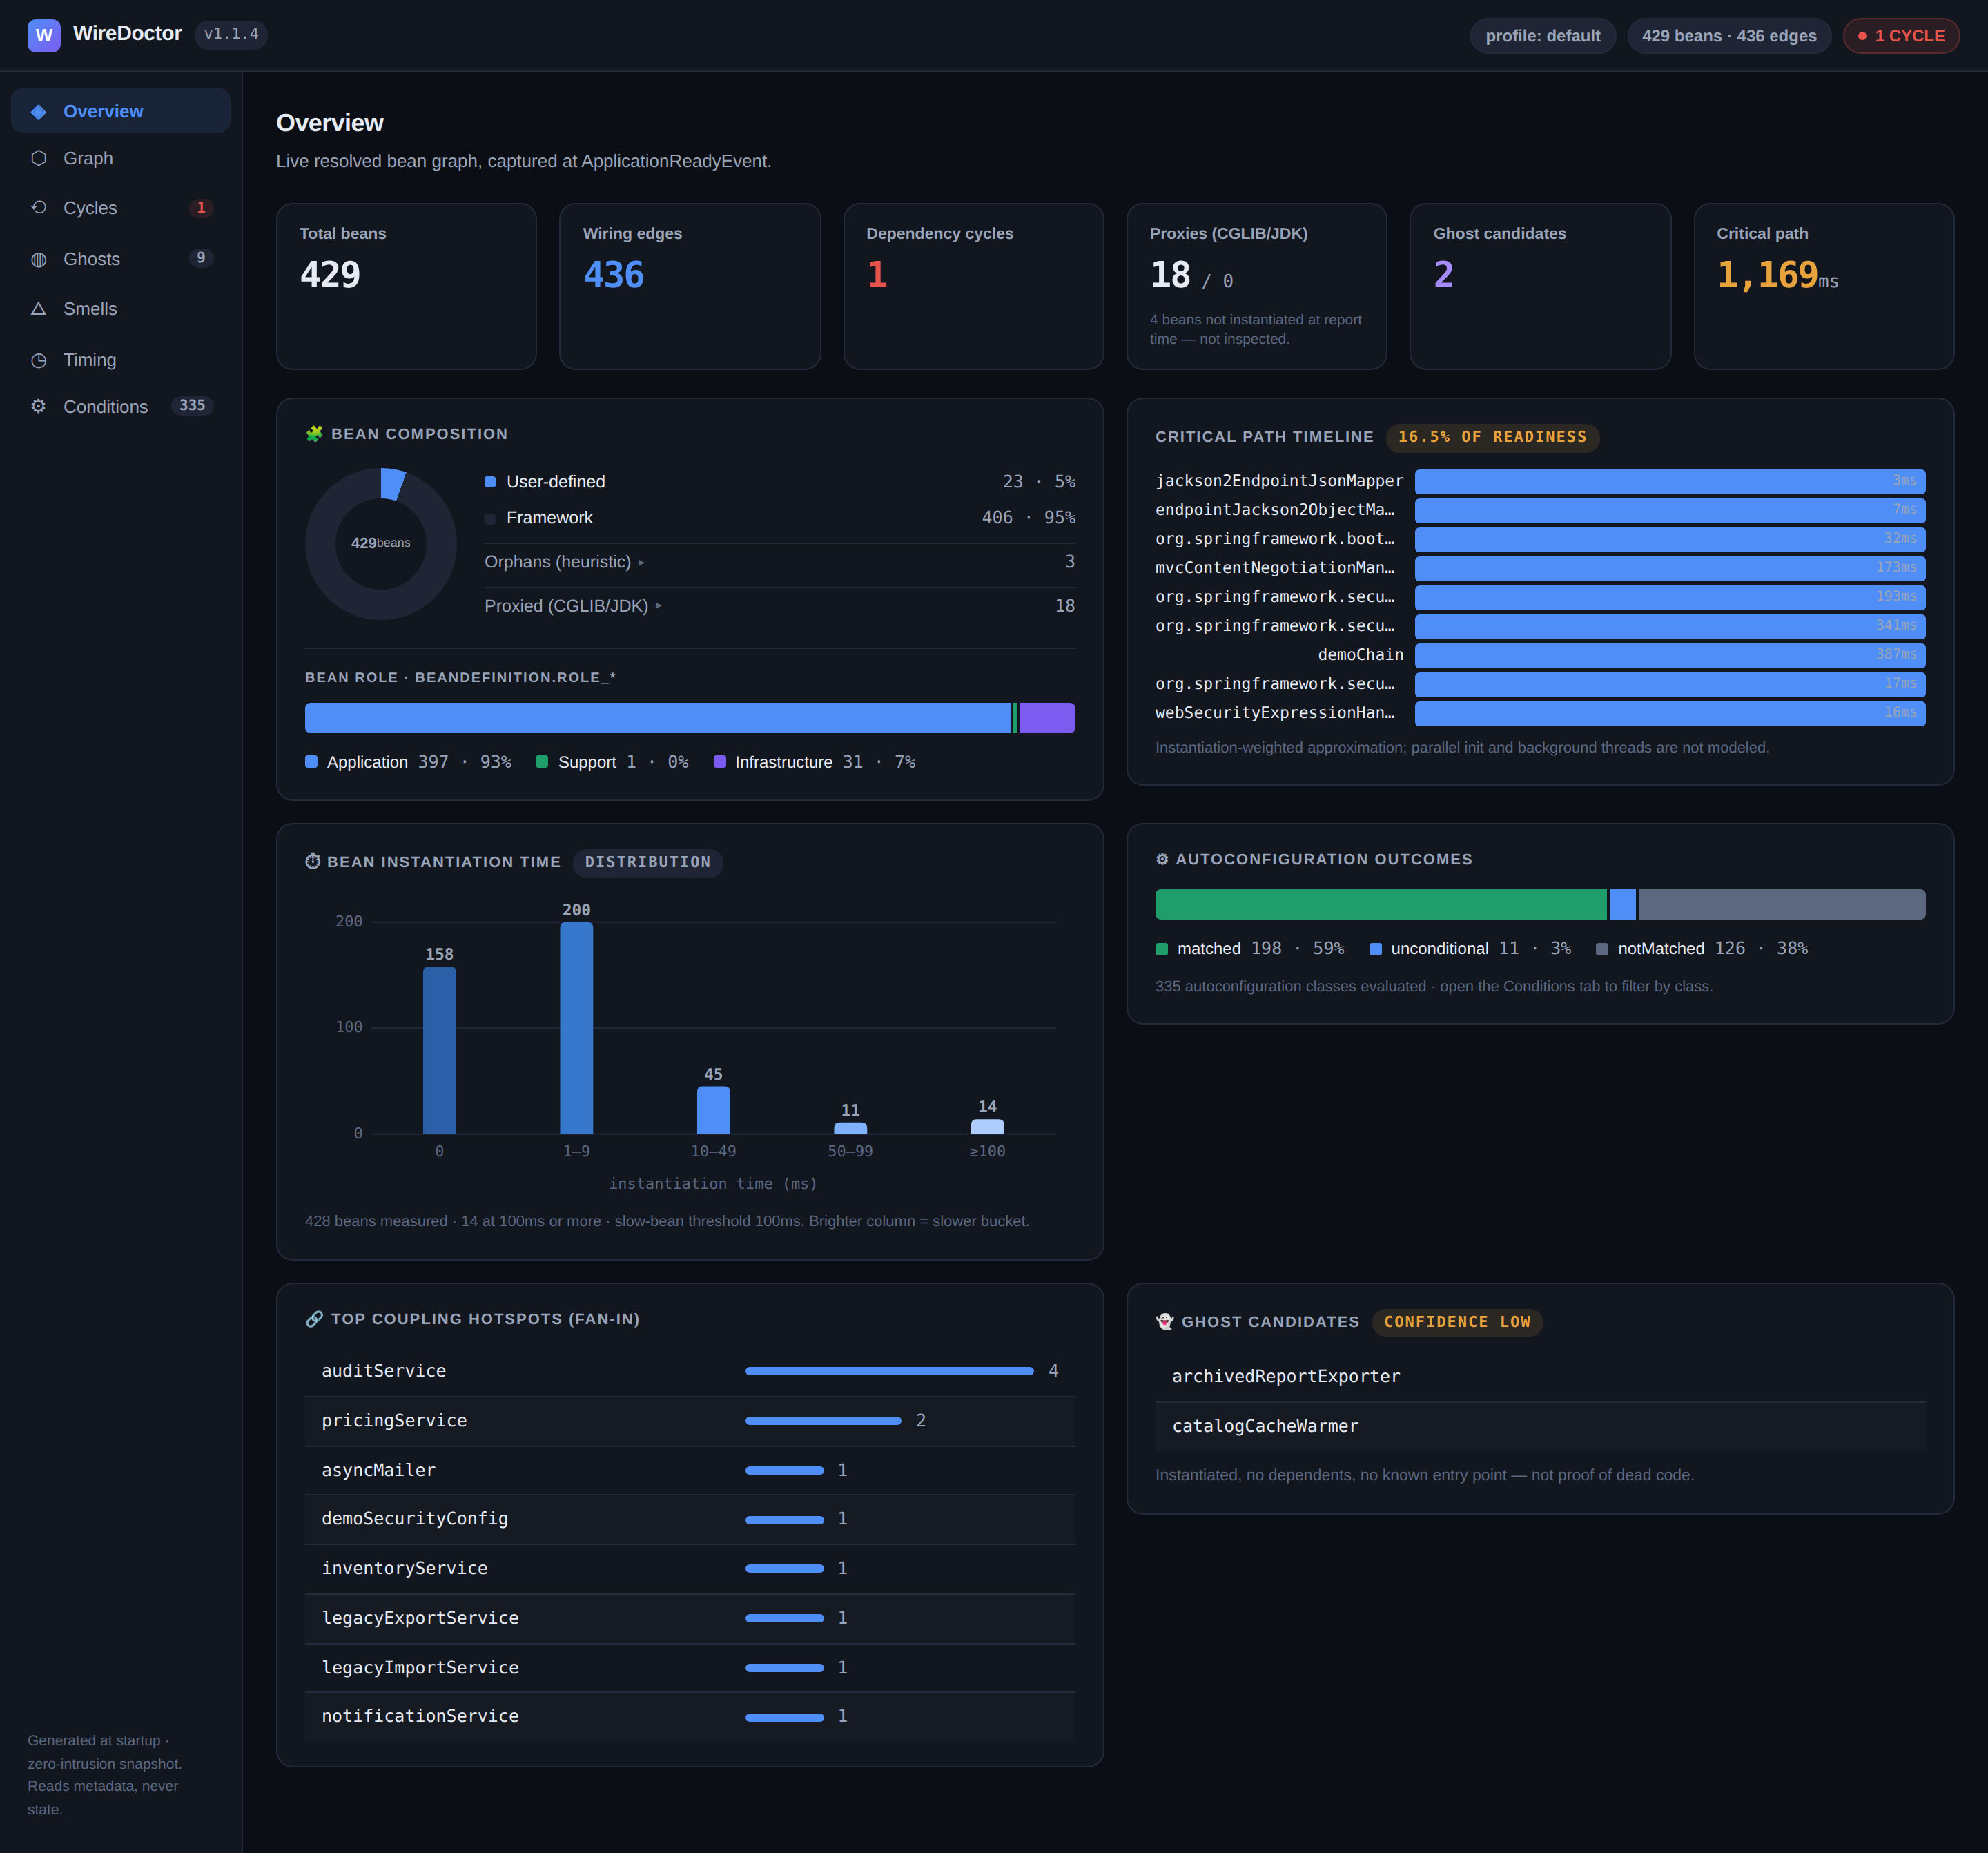
The landing tab — everything at a glance:
- Header chips (top-right): version, active profile, bean/edge counts, and the health verdict. Here it reads
HEALTHY(green) — no cycles, no armed gate tripped. The chip follows a strict precedence:GATE FAIL→N CYCLES→GATES PASS→HEALTHY, so the worst news always wins. - Stat cards: total beans (394), wiring edges (435), dependency cycles (0), CGLIB/JDK proxies (5), ghost candidates (5), and the startup critical-path cost (1,272ms).
- Bean composition: user-defined vs framework beans (51 vs 343 — a real app is mostly framework), 26 heuristic orphans, and the
BeanDefinition.ROLE_*split (368 application · 26 infrastructure). - Critical path timeline: the single most expensive dependency chain to readiness — here it ends at
initializrMetadataUpdateStrategyand accounts for 23.7% of startup. This is where a@Lazyor a lighter bean pays off most. - Bean instantiation distribution and autoconfiguration outcomes (198 matched · 18 unconditional · 146 notMatched of 362 classes) round out the page.
The sidebar footer states the trust posture: generated at startup, zero-intrusion snapshot — reads metadata, never state.
Graph tab
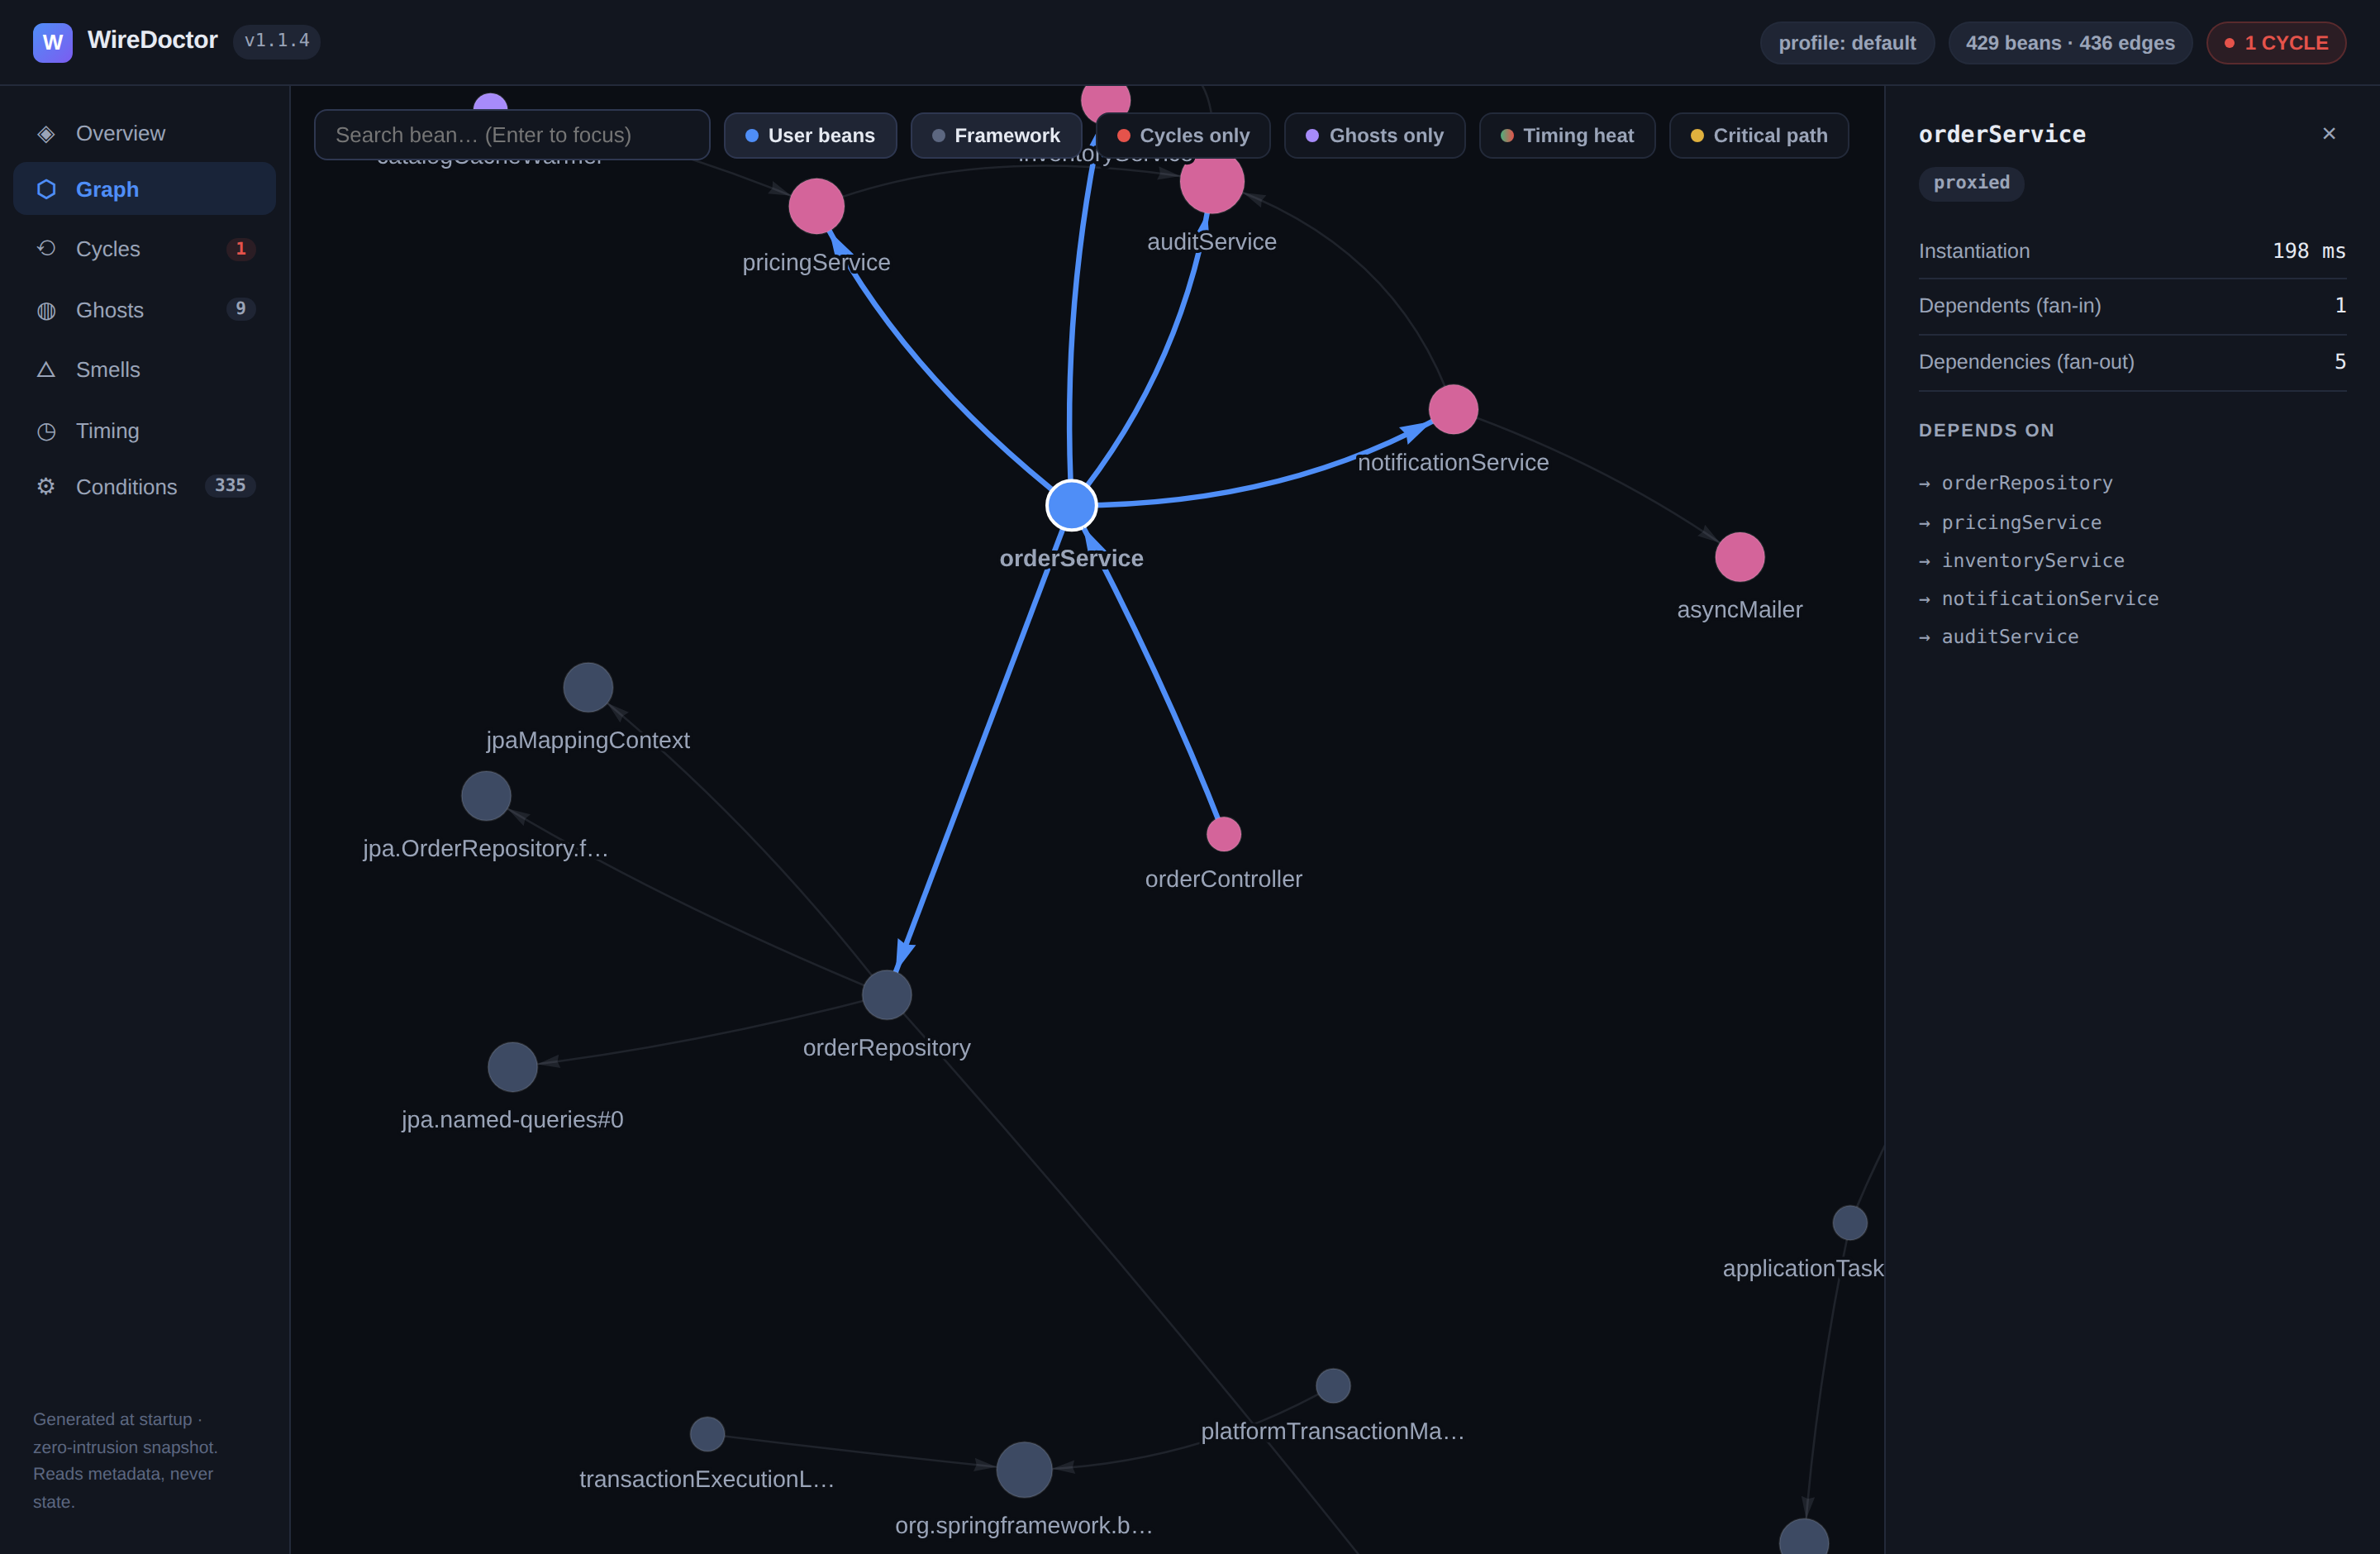
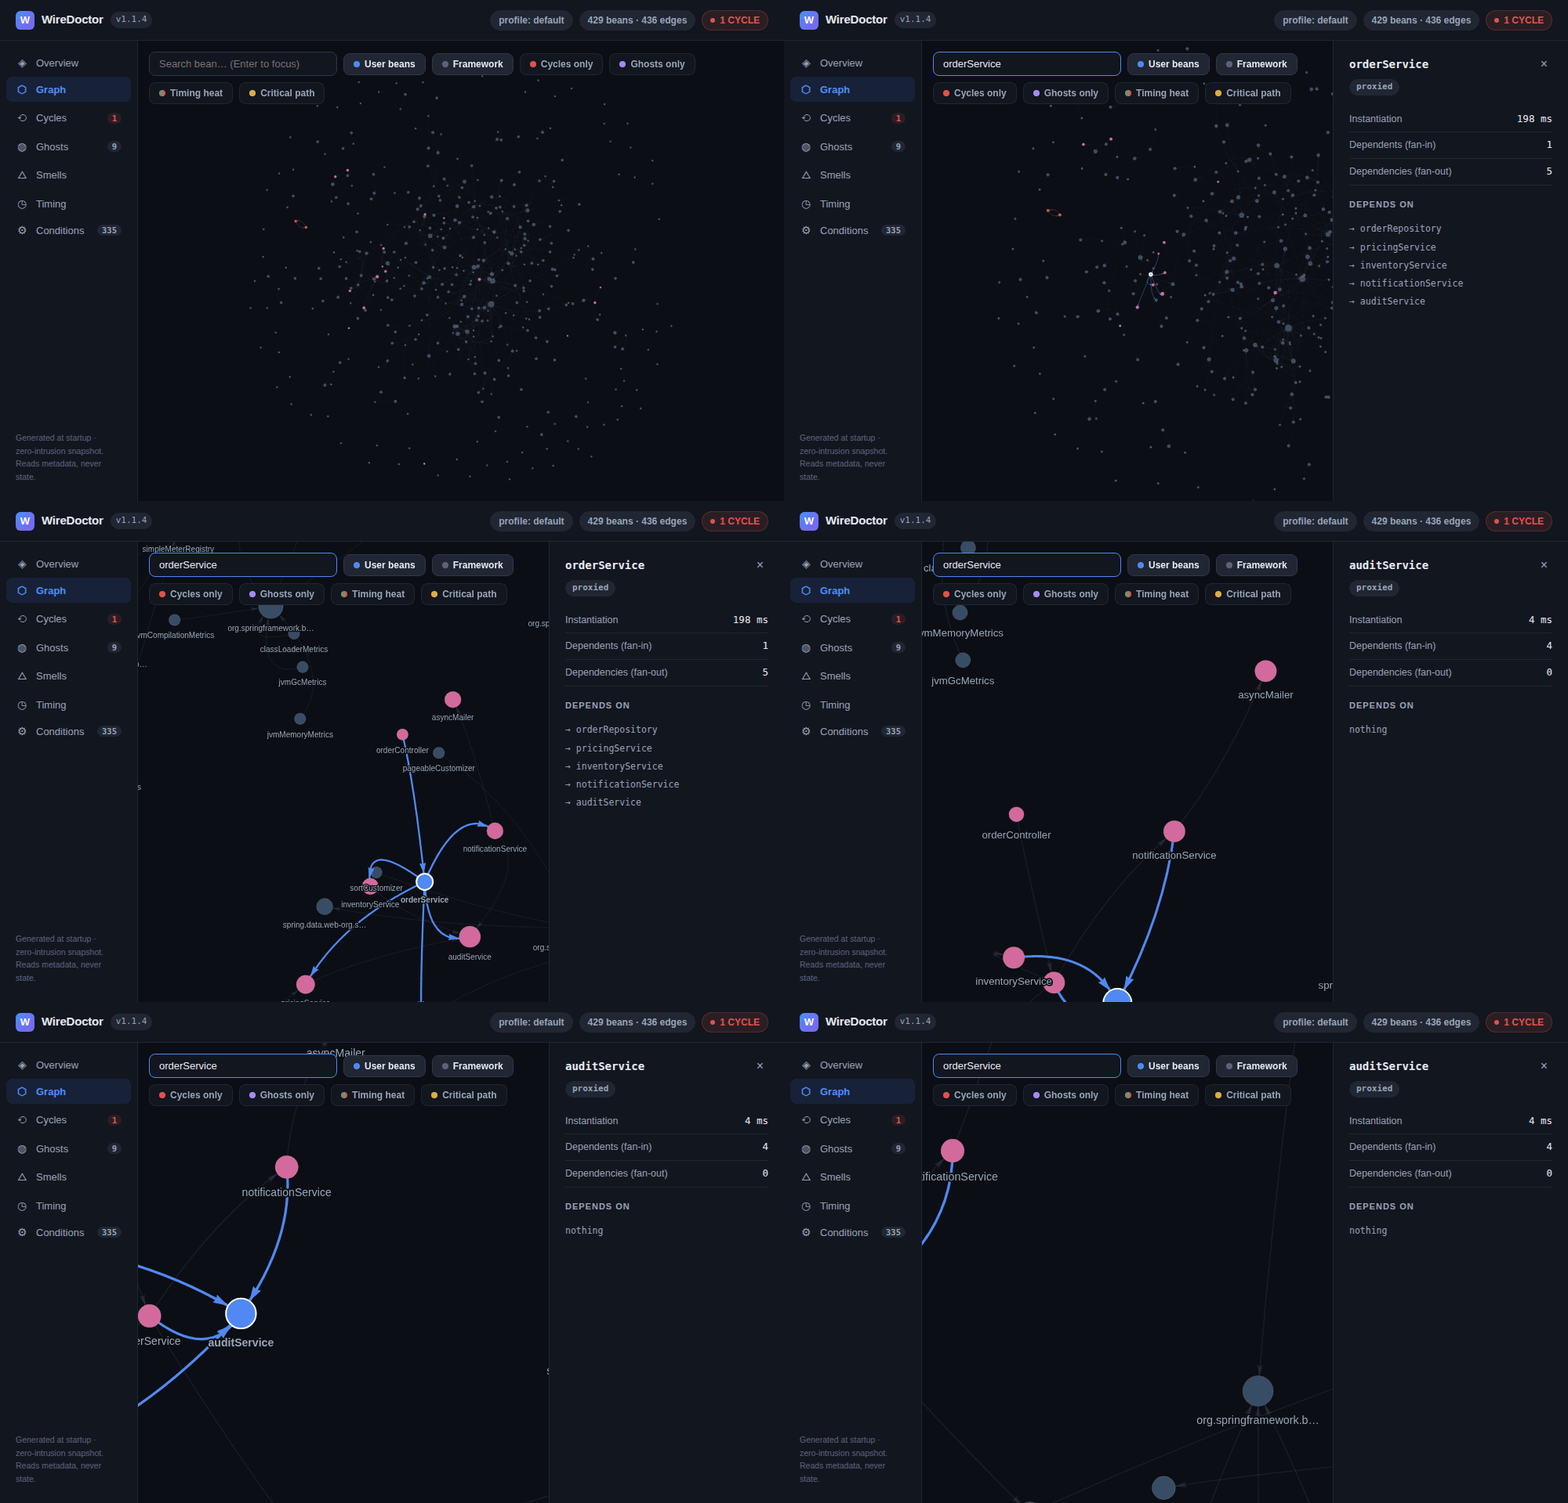
The full resolved dependency graph, rendered interactively. Filter chips toggle User beans / Framework / Cycles only / Ghosts only, and the search box focuses any bean by name. Two chips bring startup timing into the graph (v0.10.0): Timing heat recolors nodes green→red by per-bean instantiation time, and Critical path traces the readiness chain in gold.
Clicking a node — or searching and pressing Enter — opens the inspector panel: health, instantiation time, an on critical path tag, fan-in (dependents), fan-out (dependencies), and the exact dependency list. Here initializrMetadataProvider — a central bean in Initializr — is focused, so you can answer “what actually depends on this?” without grepping.
Cycles tab
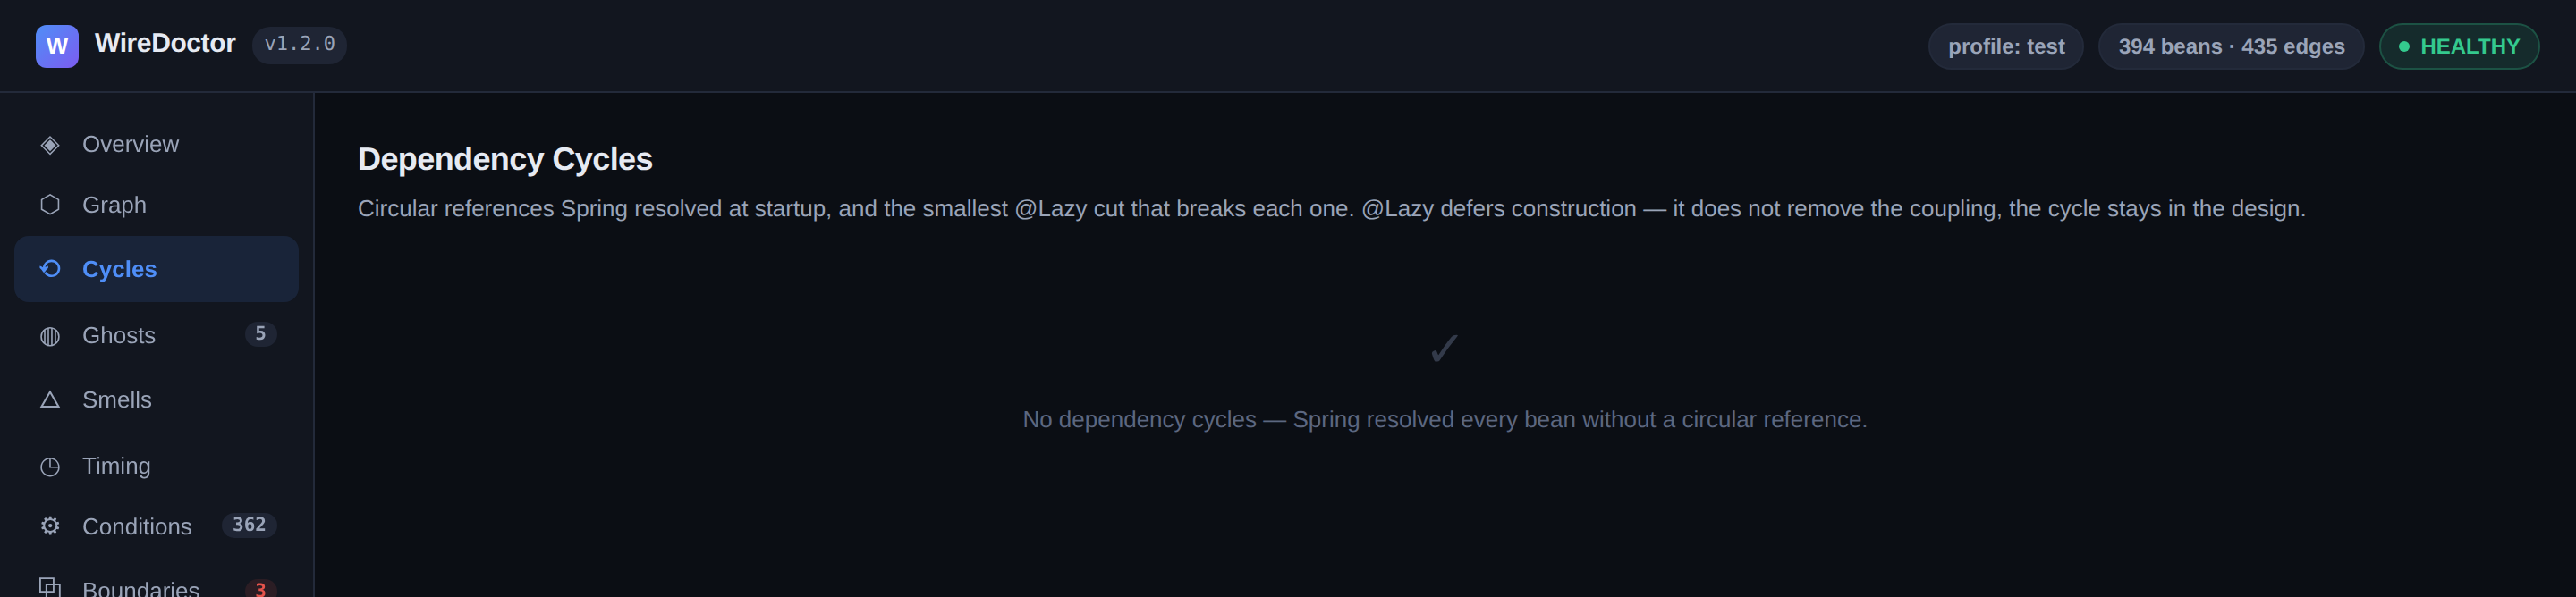
WireDoctor’s Tarjan SCC detector runs on the resolved graph and lists every circular dependency, plus the smallest @Lazy cut that breaks each one. On this real run it finds none — “No dependency cycles — Spring resolved every bean without a circular reference.”
That is the honest, common case for a well-kept codebase, and it is worth showing: the detector is always on, so the day a cycle sneaks in (a new @Autowired back-edge), it turns red here and — with the baseline committed — fails CI via the regression gate. A clean tab today is the baseline that makes tomorrow’s regression visible.
Ghosts tab
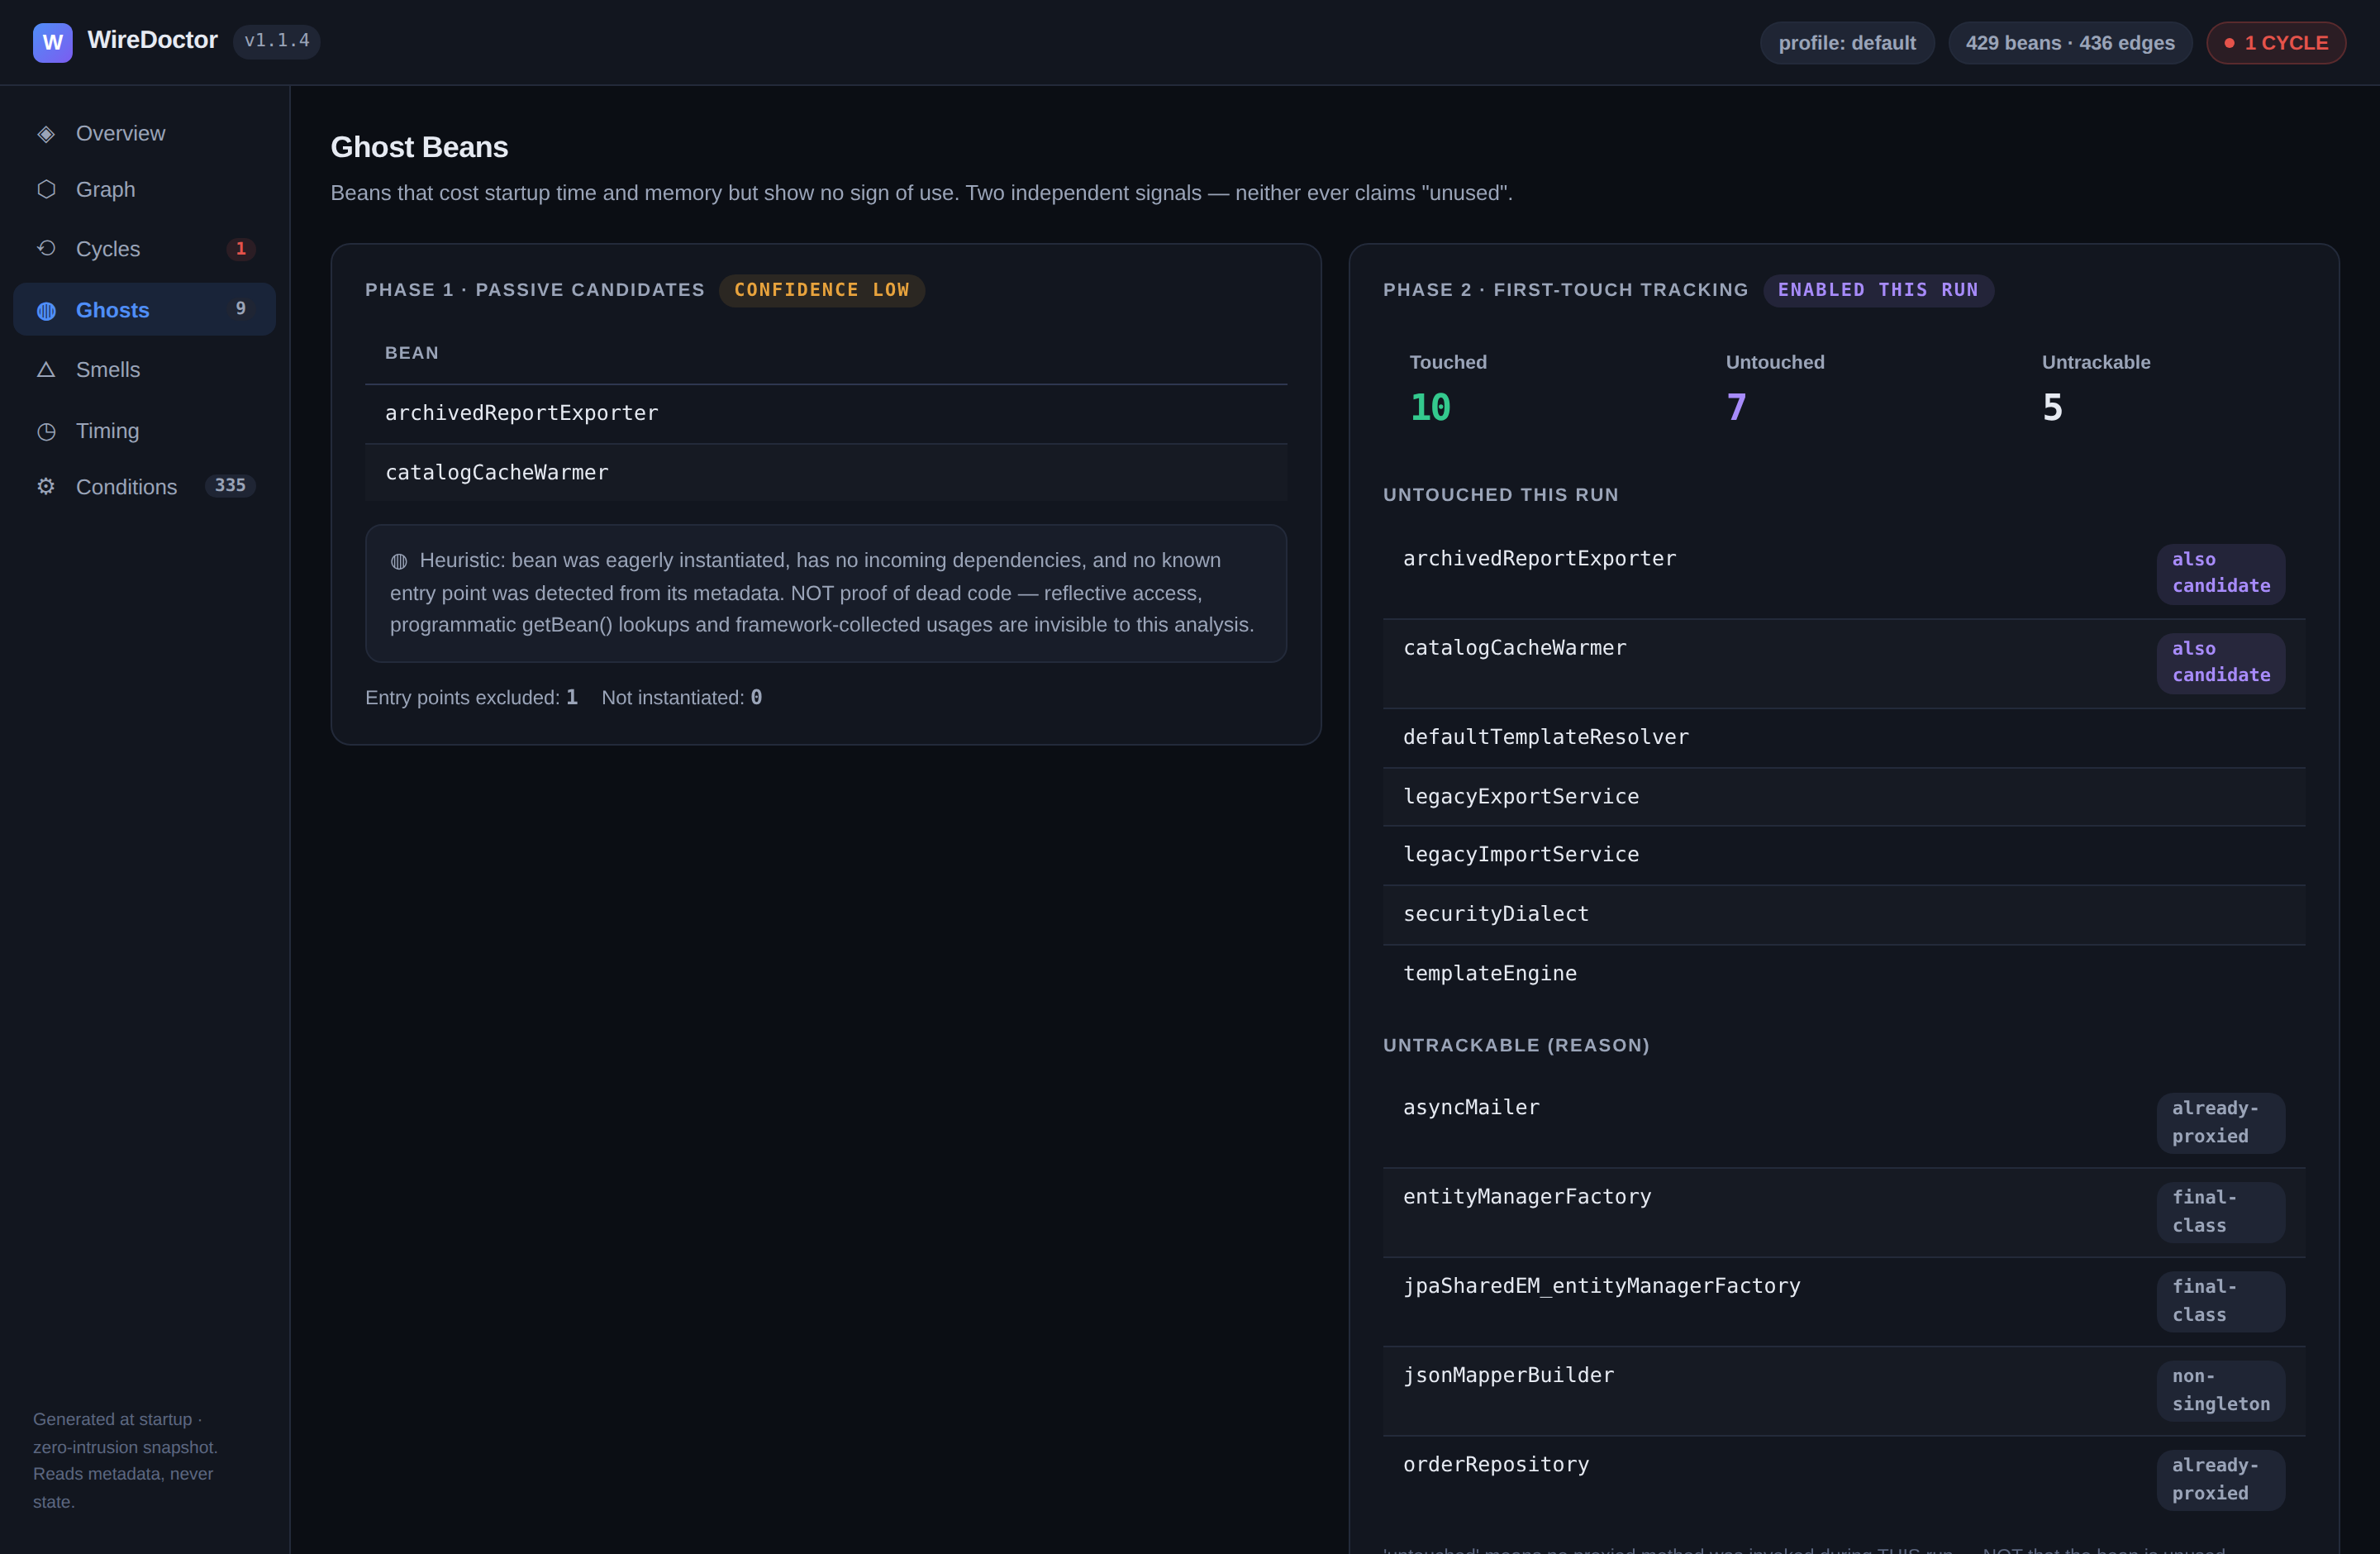
Beans that cost startup time and memory but show no sign of use — eagerly instantiated ∧ zero incoming dependencies ∧ no detectable entry point (@Controller, @Scheduled, CommandLineRunner, …). Deliberately labeled CONFIDENCE LOW — it is a static signal. On this run it flags 5 candidates, among them dockerServiceResolver and indentingWriterFactory plus a few Azure autoconfiguration beans that are wired but never reached on this path.
An opt-in first-touch tracker (wiredoctor.ghost-tracking.enabled=true, dev/staging only) goes further — wrapping eligible beans in a counting proxy and reporting touched/untouched at shutdown or via /actuator/wiredoctor/ghosts. WireDoctor never claims “unused”, only “never invoked during this run” — the distinction is printed right in the UI.
Smells tab
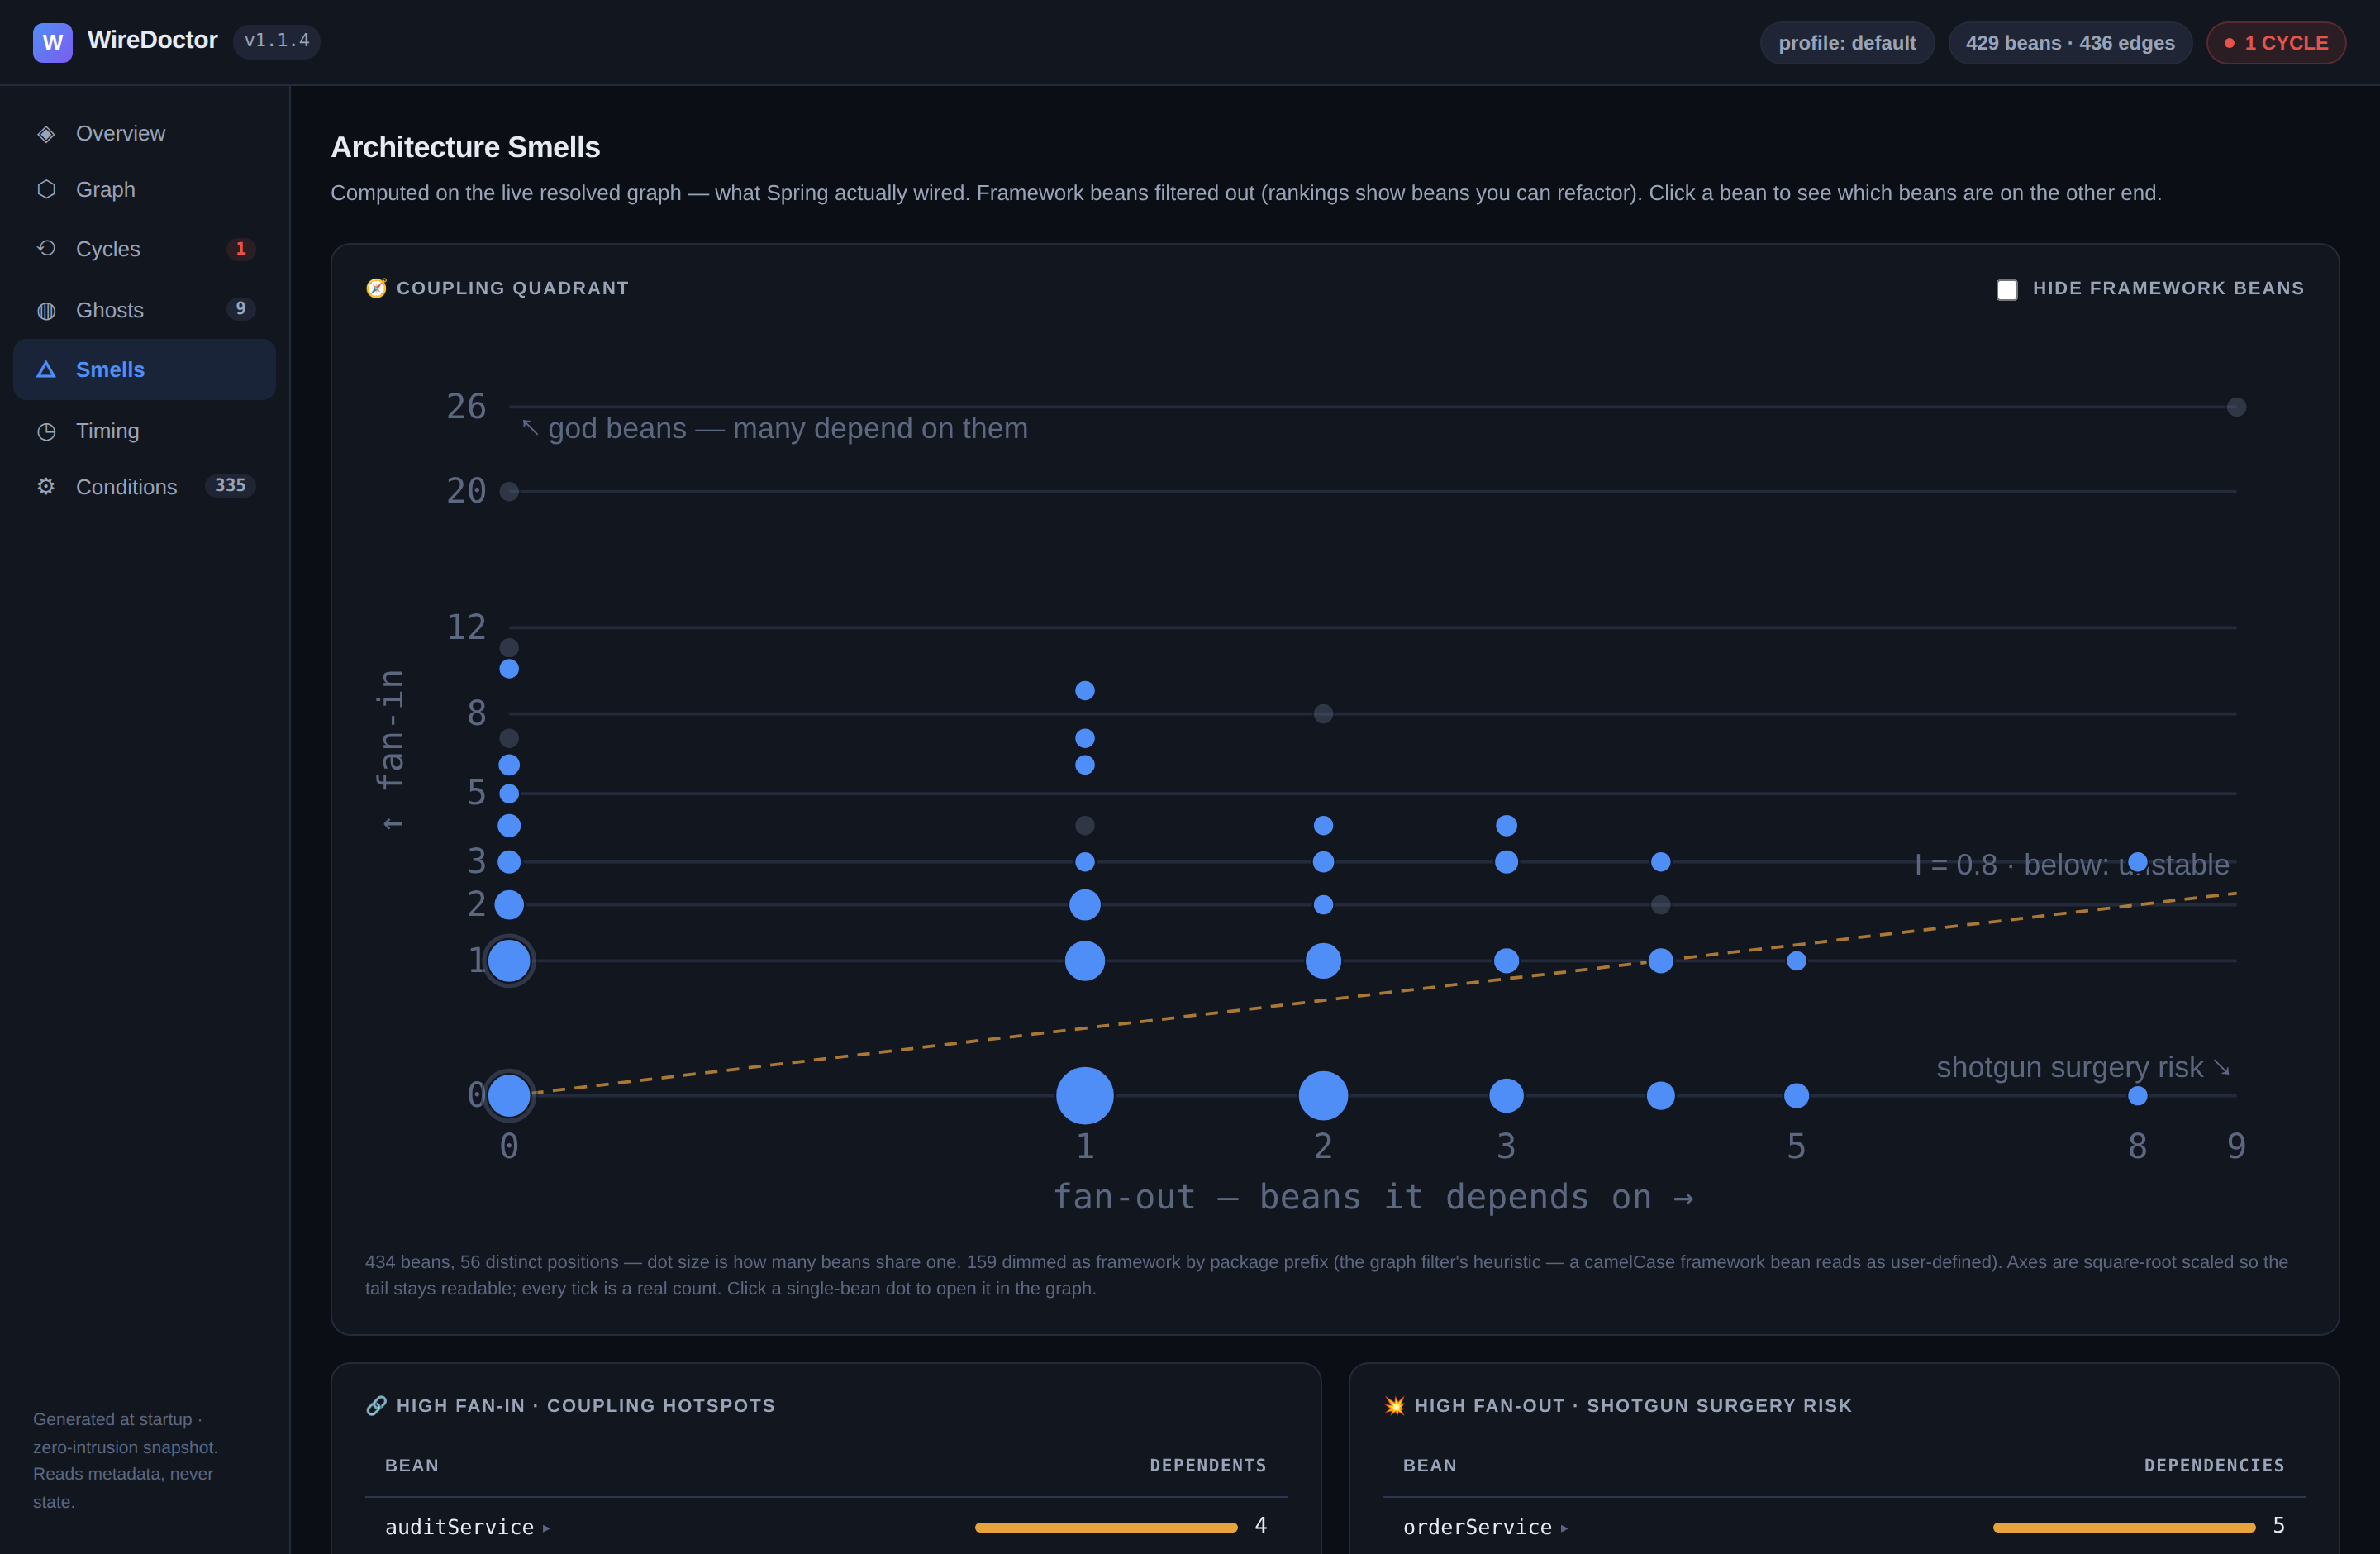
Architecture smells on the live resolved graph — what Spring actually wired. Framework beans are filtered out of the rankings so every row is something you can act on:
- High fan-in · coupling hotspots:
AzureTokenCredentialAutoConfigurationtops it with 8 dependents — change it and the blast radius is widest. - High fan-out · shotgun-surgery risk:
azureTokenCredentialResolverleads with 5 dependencies. - Unstable beans: ranked by instability
I = fanOut / (fanIn + fanOut);commandLineMetadataControllersits at I = 1.0 (a pure consumer). - Every row expands to the actual beans on the other end (v1.1.3), and the coupling quadrant scatters fan-out vs fan-in against the
I = 0.8instability line, so you see the shape the top-10 lists hide.
Timing tab
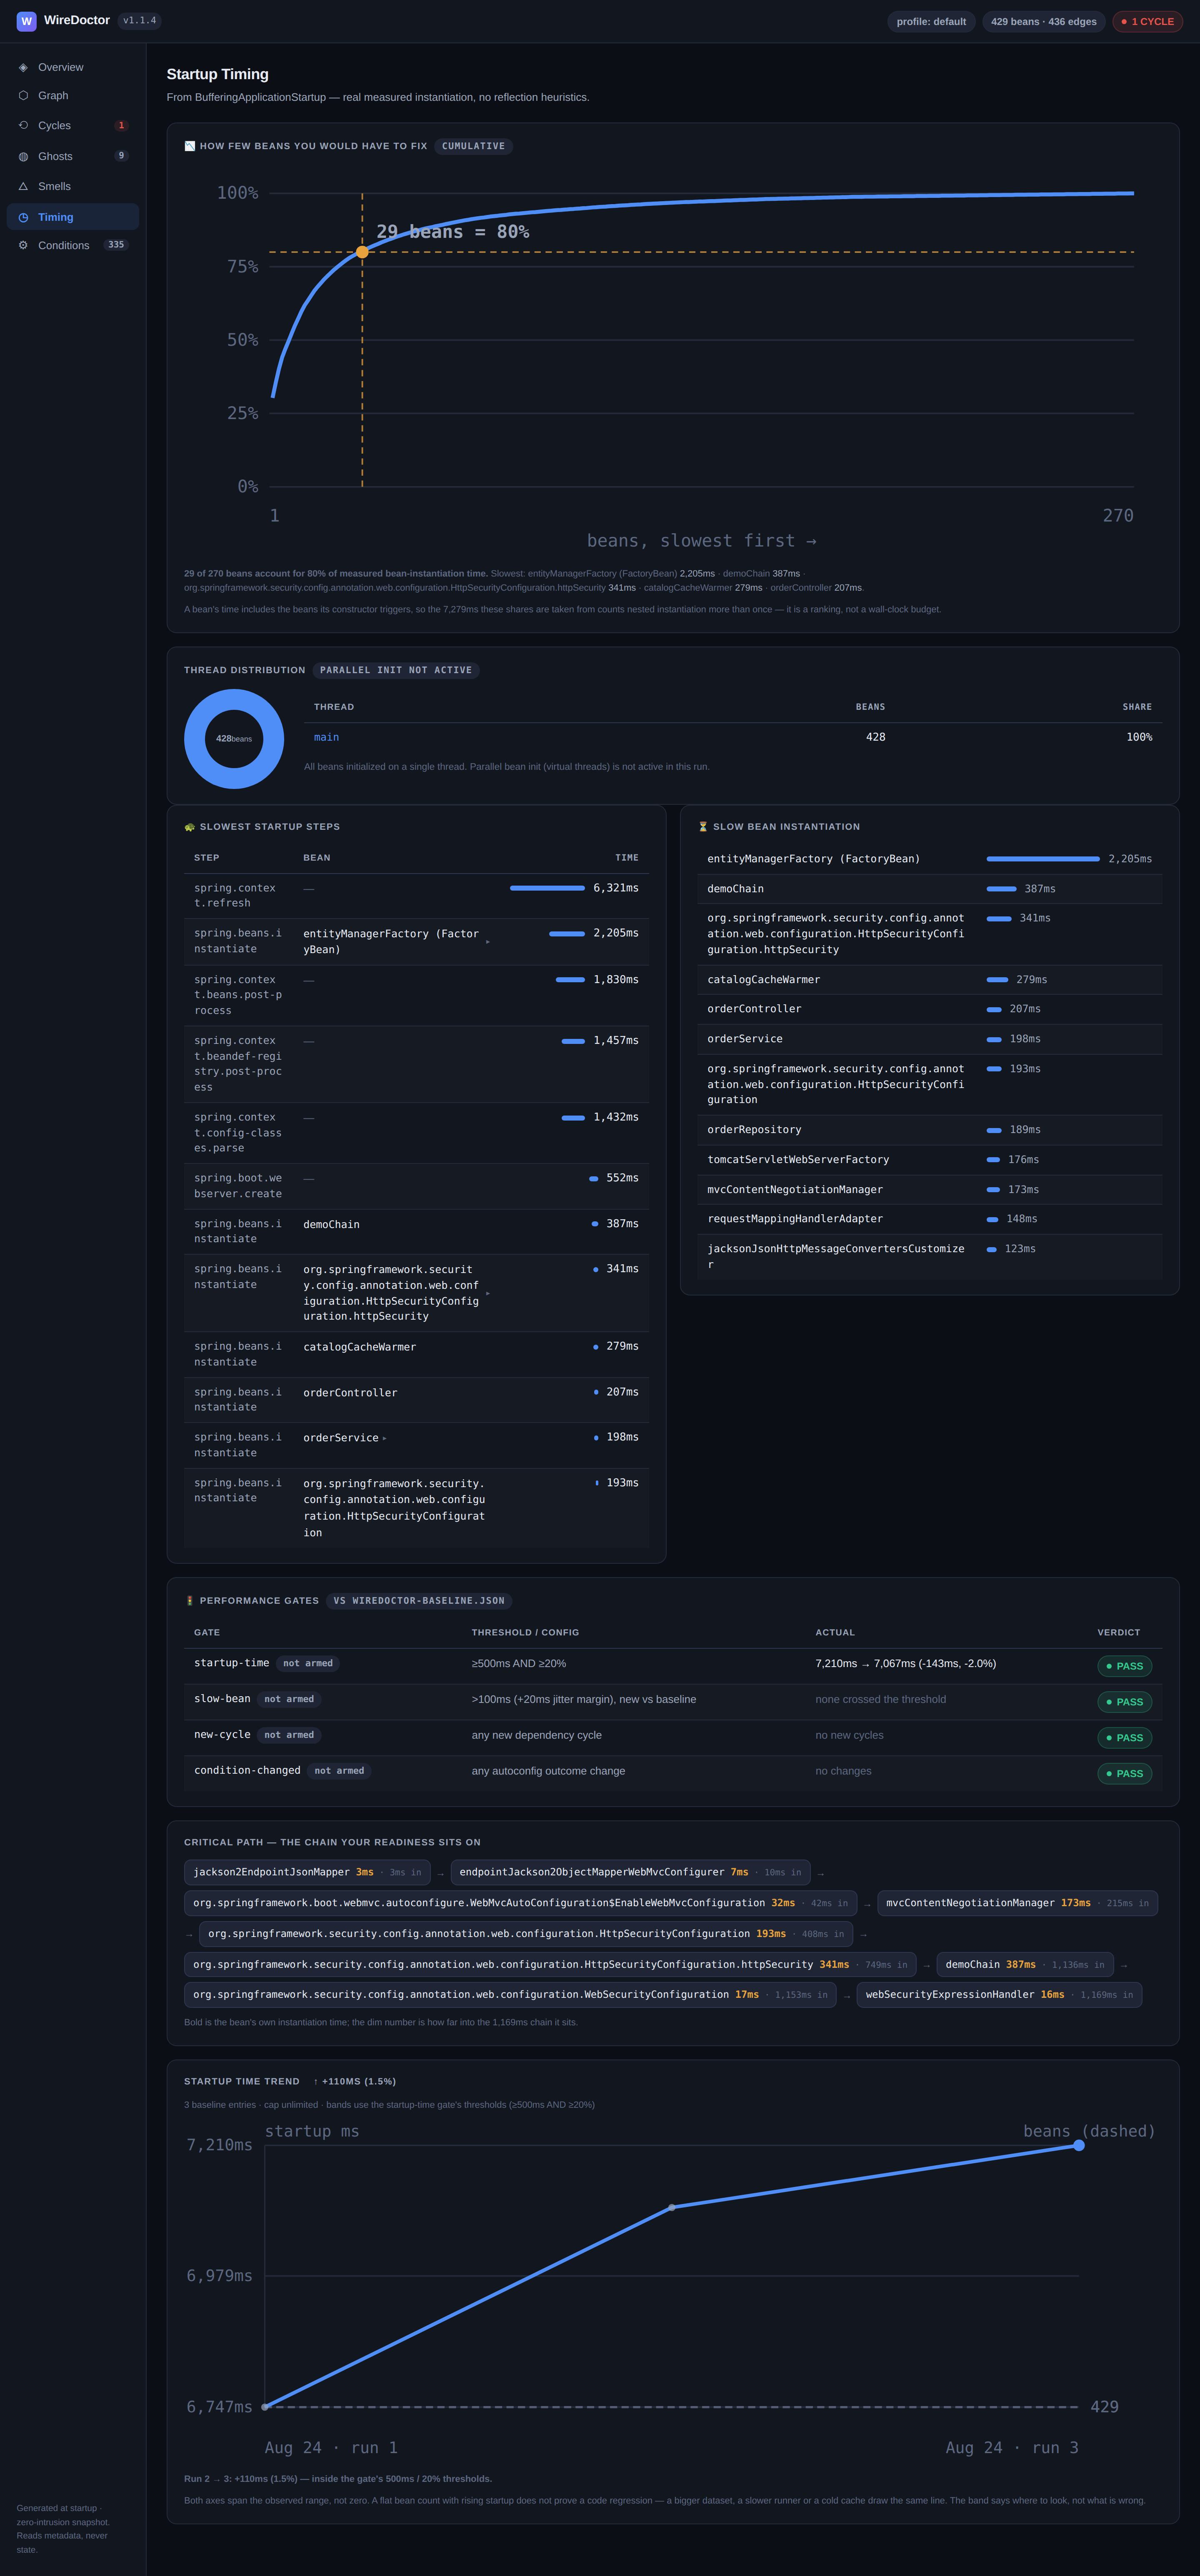
Real measured startup from BufferingApplicationStartup — no reflection heuristics:
- Slow bean instantiation: every bean over
slow-bean-threshold-ms(default 100ms), ranked. Here 20 beans cross it, led byinitializrMetadataUpdateStrategy(484ms),bomRangesInfoContributor(414ms) andinitializrMetadataProvider(413ms) — the metadata-loading chain Initializr builds at boot. - Slowest startup steps: Boot lifecycle phases, with
spring.context.refresh(4,251ms) at the top. - Thread distribution (v1.1.0): which threads instantiated beans — this app initializes across
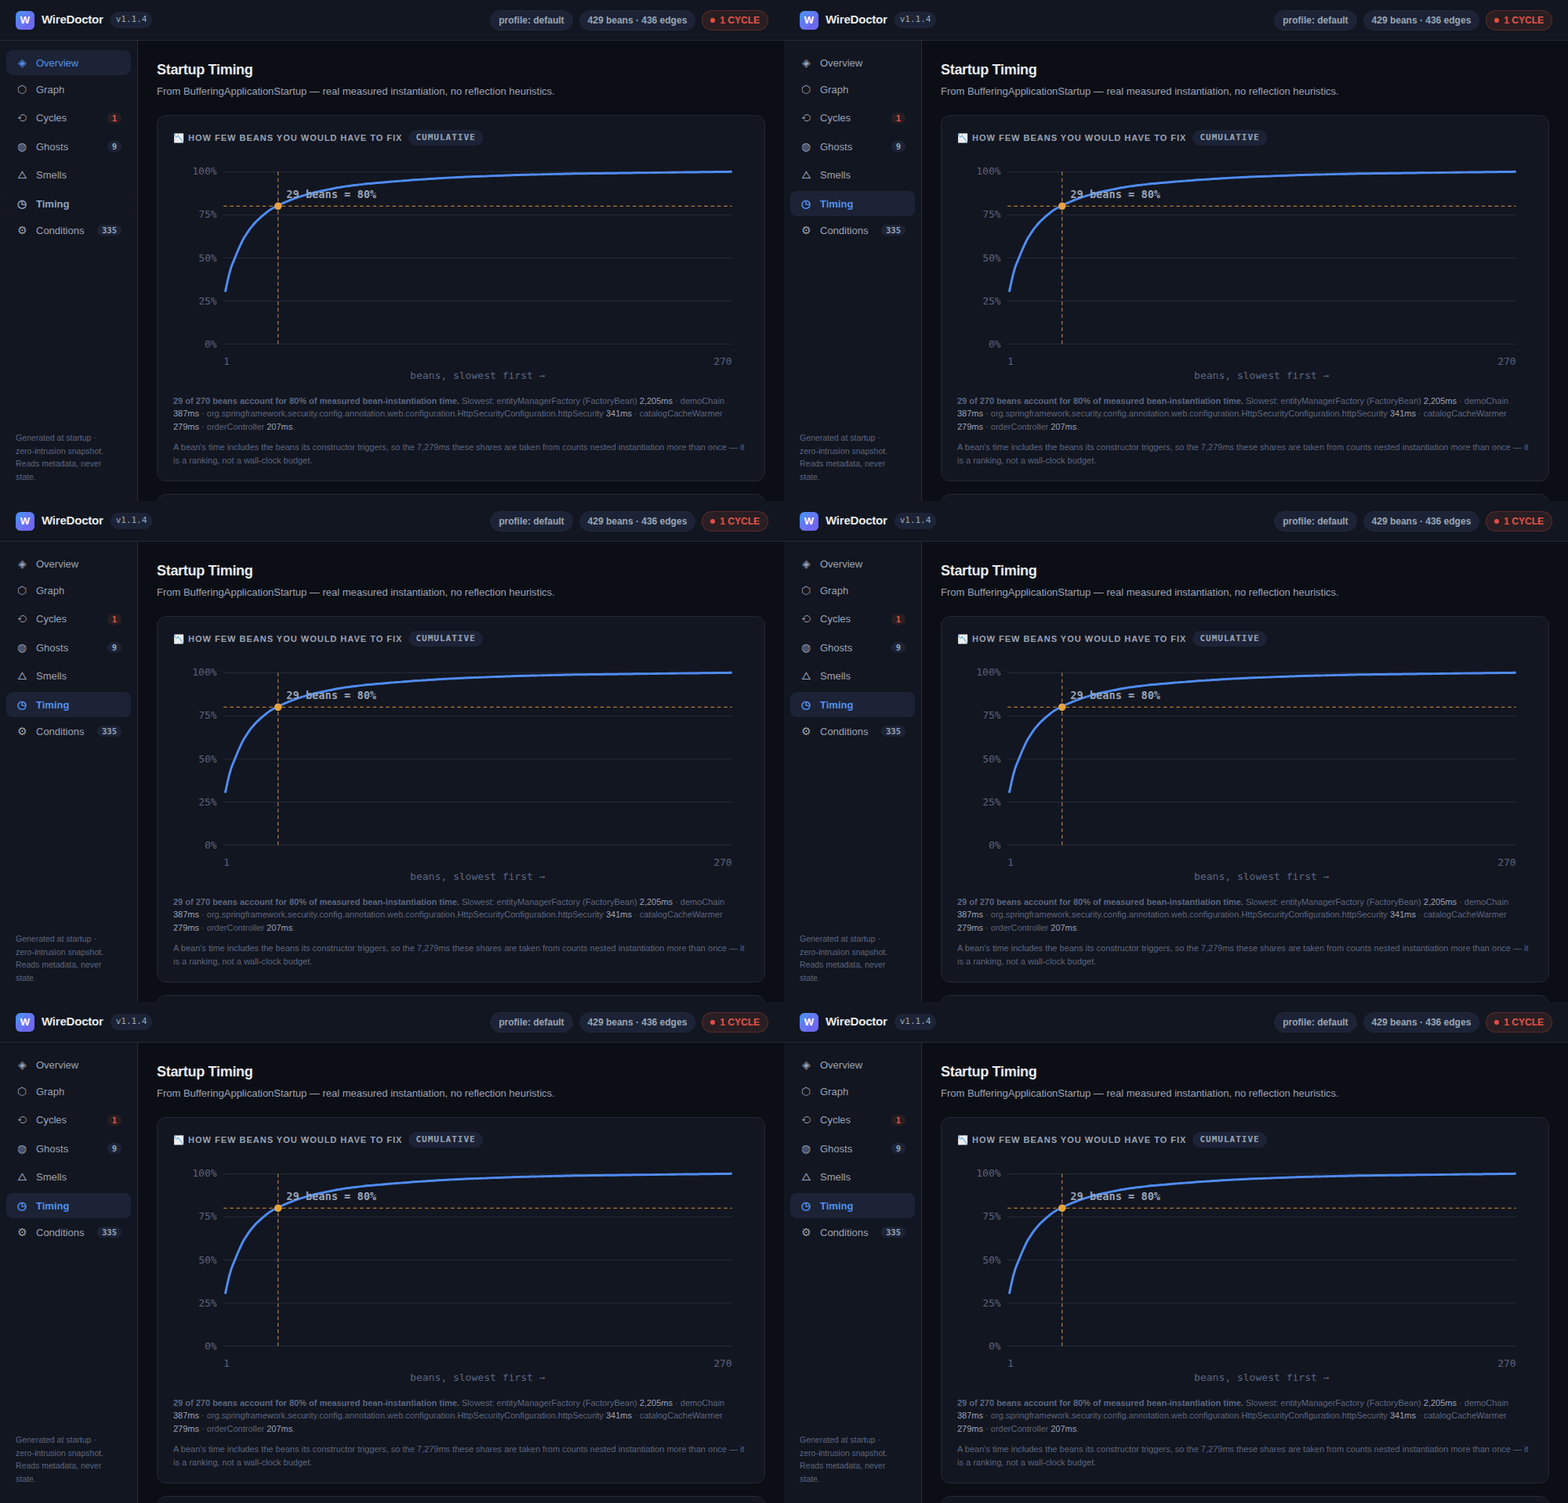
ForkJoinPoolworkers, not justmain, so the card reflects genuine parallel init. - A Pareto curve of cumulative instantiation time with the 80% knee, and Performance gates (v0.7.1) — each with its threshold, actual value, and a PASS/FAIL/NOT RUN chip — the UI counterpart of
wiredoctor.fail-on(Performance Gates).
Conditions tab
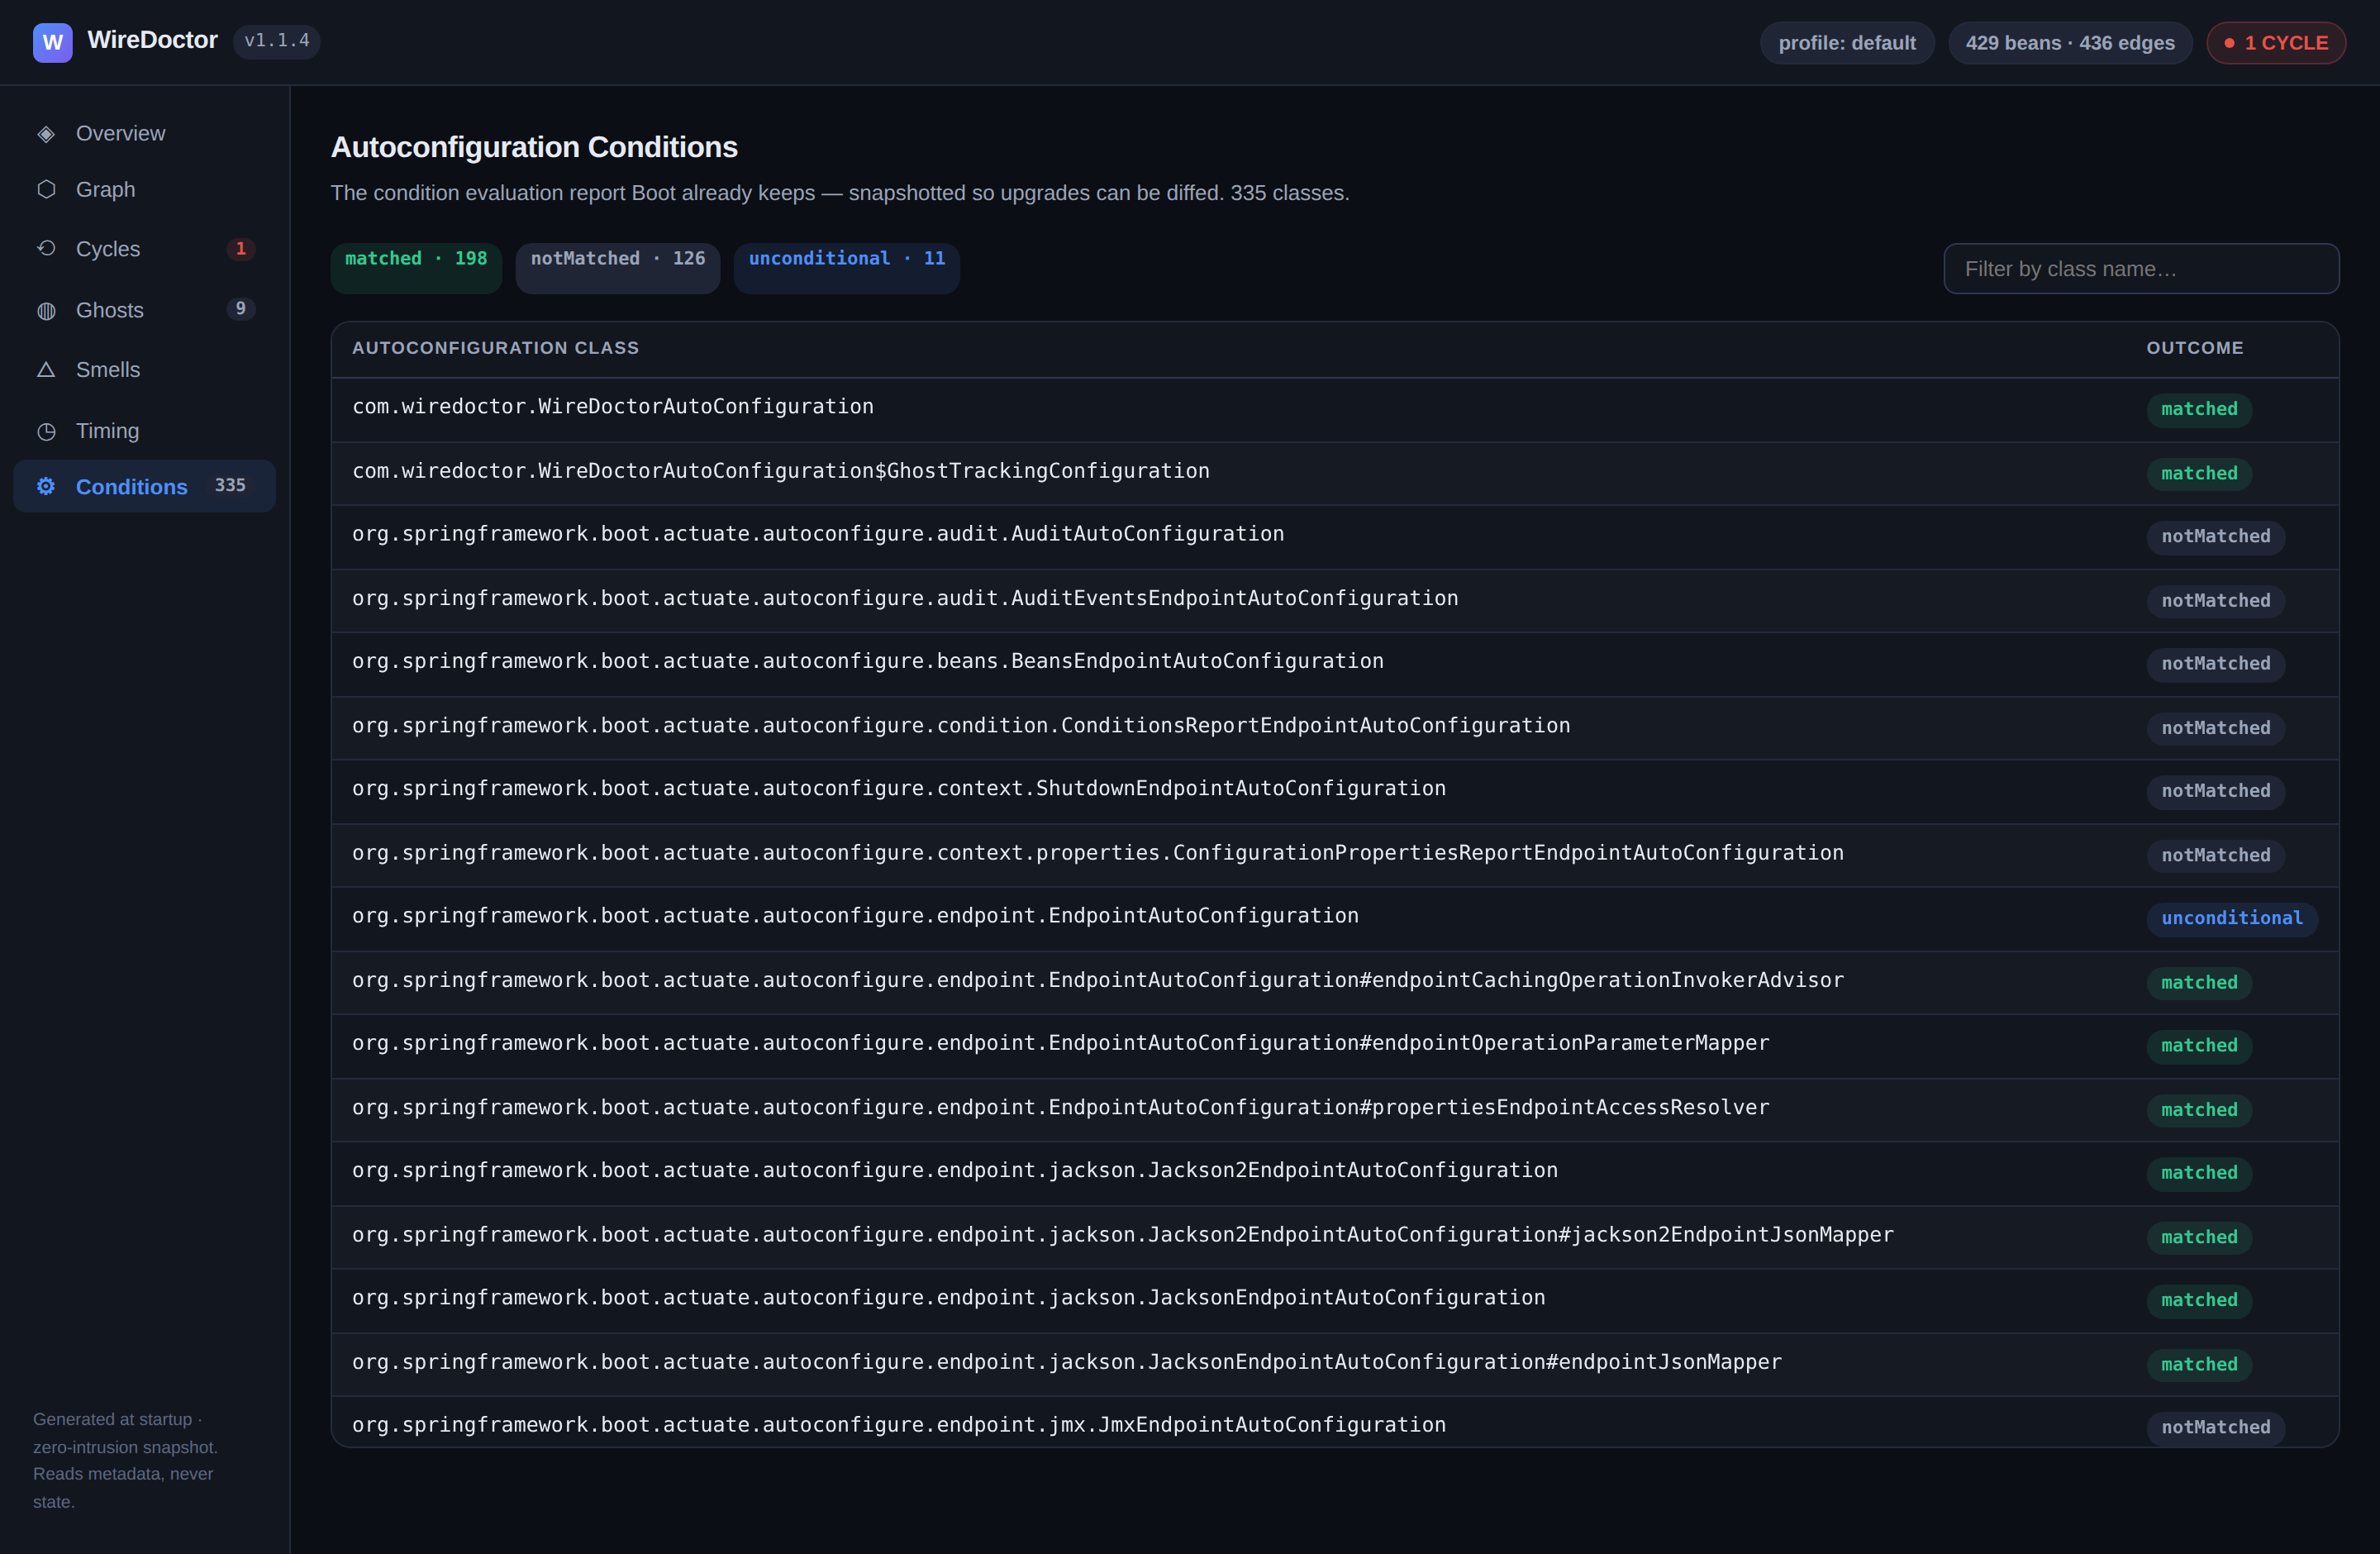
Spring Boot’s condition evaluation report, snapshotted into the report — 362 autoconfiguration classes here (198 matched · 146 notMatched · 18 unconditional), each tagged and filterable by class name.
Why snapshot something Boot already keeps? Because a snapshot can be diffed. Commit it in your baseline and a Boot upgrade that silently flips an autoconfiguration from matched → notMatched is caught in CI with the exact condition message — before you debug the mystery of the vanished bean. See the Upgrade Guard.
Module Boundaries tab (v1.2.0)
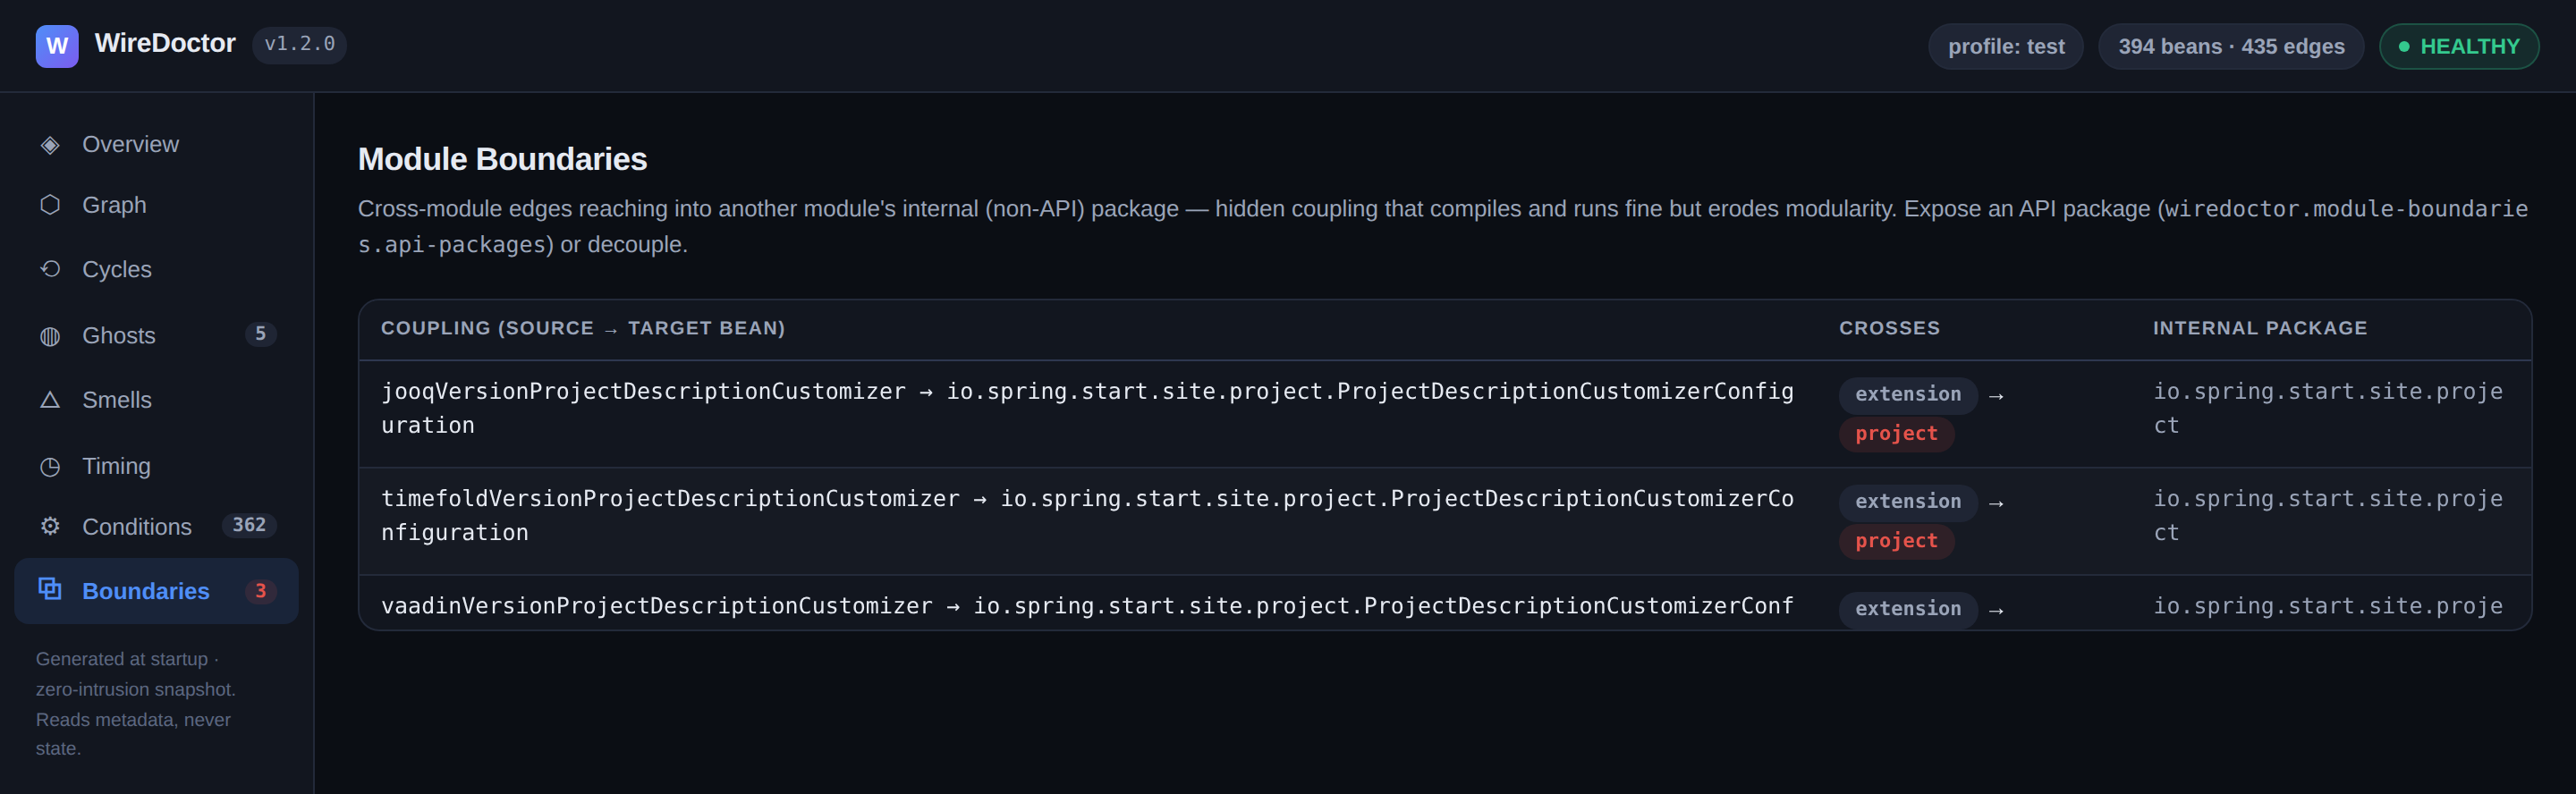
New in 1.2.0, and the reason this tour runs on real Initializr: declare your modules by package prefix and WireDoctor flags every edge that reaches from one module into another module’s internal (non-API) package — hidden coupling that compiles and runs fine but quietly erodes modularity. It reads the resolved graph, so it catches what Spring actually wired, not what the imports suggest.
With io.spring.start.site.extension and io.spring.start.site.project declared as modules, it finds 3 violations: jooqVersionProjectDescriptionCustomizer, timefoldVersionProjectDescriptionCustomizer and vaadinVersionProjectDescriptionCustomizer all reach from extension into project’s internal ProjectDescriptionCustomizerConfiguration. Each row names the crossing edge, the modules it spans, and the internal package. The same list lands in wiredoctor-report.json under boundaryViolations, and wiredoctor-gate.status records a FAIL:boundary-violation verdict for CI — even with no baseline. See the Module Boundaries guide.
Try it yourself
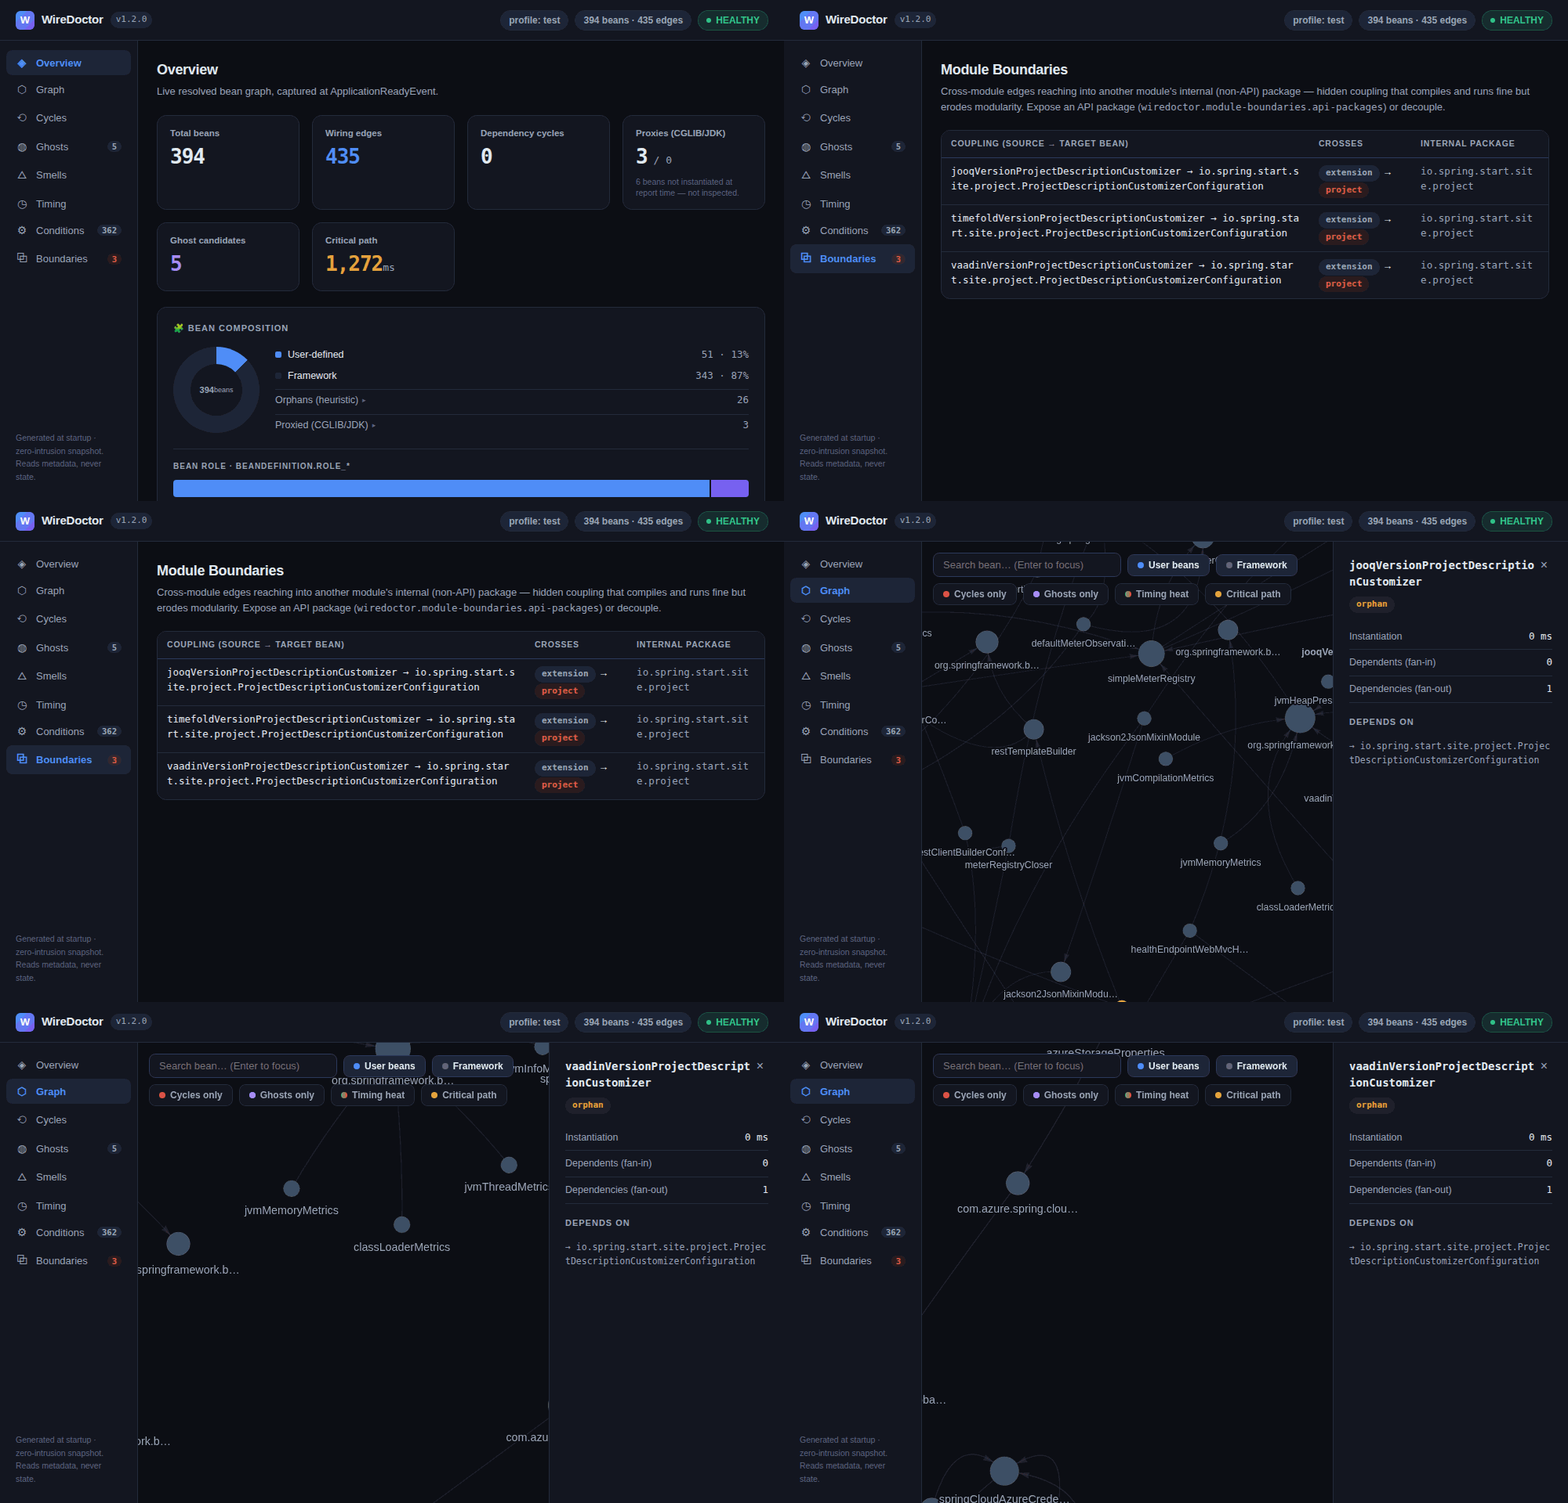
Open this exact report live, grab the whole set from sample/v1.2.0/, or add the dependency to your own app — the report appears in your working directory on next startup. See Quick start.